
Page 37 - economic review
P. 37
9
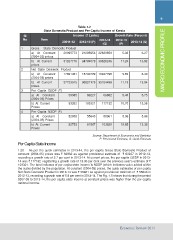
Table 1.2 MACRO ECONOMIC PROFILE
State Domestic Product and Per Capita Income of Kerala
Sl Income (` Lakhs) Growth Rate (Percent)
No Item 20011-12 2012-13 (P) 2013-14 2012-13 2013-14 (Q)
(Q) (P)
1 Gross State Domestic Product
a) At Constant 20095773 21285953 22620850 5.92 6.27
(2004-05) prices
b) At Current 31267716 34784078 39628246 11.24 13.92
prices
2 Net State Domestic Product
a) At Constant 17691461 18732729 19947798 5.89 6.49
(2004-05) prices
b) At Current 27723315 30827173 35124499 11.19 13.94
prices
3 Per Capita GSDP (`)
a) At Constant 59985 63227 66862 5.40 5.75
(2004-05) Prices
b) At Current 93332 103321 117132 10.70 13.36
Prices
4 Per Capita NSDP (`)
a) At Constant 52808 55643 58961 5.36 5.96
(2004-05) Prices
b) At Current 82753 91567 103820 10.65 13.38
Prices
Source: Department of Economics and Statistics
P: Provisional Estimate, Q: Quick Estimate
Per Capita State Income
1.20 As per the quick estimates in 2013-14, the per capita Gross State Domestic Product at
constant (2004-05) prices was ` 66862 as against provisional estimate of ` 63227 in 2012-13,
recording a growth rate of 5.7 per cent in 2013-14. At current prices, the per capita GSDP in 2013-
14 was ` 117132 registering a growth rate of 13.36 per cent over the previous year’s estimate of `
103321. The best indicator of per capita state income is NSDP (which indicates value added within
the state) divided by the population. At constant (2004-05) prices, the quick estimates of per capita
Net State Domestic Product in 2013-14 was ` 58961 as against provisional estimate of ` 55643 in
2012-13, recording a growth rate of 5.9 per cent in 2013-14. The Fig. 1.5 shows that during the period
2007-08 to 2013-14, the per capita state income at constant prices was higher than the per capita
national income.
Economic Review 2014