
Page 36 - economic review
P. 36
8
MACRO ECONOMIC PROFILE 5 Per capita Gross 43657 45046 46568 69814 77148 84938
(3.2) (3.4) (10.5) (10.1))
domestic product
(`)
6 Per capita Net 38433 39394 40455 62494 68798 75420
domestic product (2.50) (2.69) (10.09) (9.63)
(`)
Note: The figures in Parenthesis shows the percentage change over previous year.
Q-Quick Estimate, P- Provisional Estimate Source: Central Statistical Organisation
1.17 The details of GDP, NDP, GNI and NNI at current and constant (2004-05) prices from 2004-
05 to 2013-14 with percentage change over previous year are given in Appendix 1.4 to 1.7. The
sectoral distribution of GDP at constant (2004-05) prices and current prices with percentage change
over previous year is given in Appendix 1.8 and Appendix 1.9
State Income
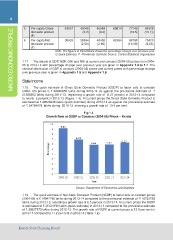
1.18 The quick estimate of Gross State Domestic Product (GSDP) at factor cost at constant
(2004- 05) prices is ` 22620850 lakhs during 2013-14 as against the provisional estimate of `
21285953 lakhs during 2012-13, registering a growth rate of 6.27 percent in 2013-14 compared
to nearly 6 percent in 2012-13 (Figure. 1.4). At current prices the Gross State Domestic Product is
estimated at ` 39628246 lakhs (quick estimate) during 2013-14 as against the provisional estimate
of ` 34784078 lakhs during 2012-13 showing a growth rate of 13.4 per cent.
Fig 1.4
Growth Rate of GSDP at Constant (2004-05) Prices – Kerala
Source: Department of Economics and Statistics
1.19 The quick estimate of Net State Domestic Product (NSDP) at factor cost at constant prices
(2004-05) is ` 19947798 lakhs during 2013-14 compared to the provisional estimate of ` 18732729
lakhs during 2012-13, recording a growth rate of 6.5 percent in 2013-14. At current prices the NSDP
is estimated at ` 35124499 lakhs (quick estimate) in 2013-14 compared to the provisional estimate
of ` 30827173 lakhs during 2012-13. The growth rate of NSDP at current prices is 13.9 per cent in
2013-14 compared to 11.2 per cent in 2012-13 (Table 1.2).
Kerala State Planning Board