
Page 355 - economic review
P. 355
327
9.22 The factors affecting unemployment in Kerala is a subject of intense debate among economists EMPLOYMENT
and social scientists. The peculiar socio-economic factors, such as the highest preference for
regular employment rather than self-employment, have contributed to the extremely high incidence
of educated unemployment in Kerala.
9.23 Estimates on key important indicators reflecting the prevalence of employment/ unemployment
in Kerala for all persons based on the surveys conducted by the NSSO in 2009-10 and 2011-12 are
given in Appendix 9.2 for comparison. All India figures may be seen in Appendix 9.3.
Employment in Organised Sector
9.24 The organised sector comprises of enterprises for which the statistics are available regularly
from the budget documents or reports; annual reports in the case of Public Sector and through
annual survey of industries in the case of registered manufacturing.
9.25 In the organised sector wages are regular and working conditions are good. But in Kerala
employment in the organised sector is coming down. For instance, persons employed in organised
sector were 12.26 lakh in 2000 and it declined to 11.40 lakh in 2005 and to 10.88 lakh in 2013.
However, the number rose marginally to 11.29 lakh in 2014.
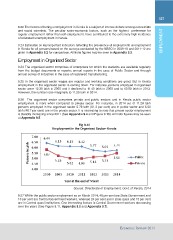
9.26 The organised sector comprises private and public sectors and in Kerala public sector
employment is more when compared to private sector. For instance, in 2014 out of 11.29 lakh
persons employed in the organised sector 5.79 lakh (51.3 per cent) are in public sector and 5.50
lakh (48.7 per cent) are in the private sector. It is interesting to note that private sector employment
is steadily increasing since 2011 (See Appendix 9.4 and Figure 9.10). All India figures may be seen
at Appendix 9.5.
Fig 9.10
Employment in the Organized Sector- Kerala
Source: Directorate of Employment, Govt. of Kerala, 2014
9.27 Within the public sector employment as on March 2014, 46 per cent are State Government and
10 per cent are Central Government workers, whereas 24 per cent are in state quasi and 15 per cent
are in Central quasi institutions. One interesting feature is Central Government workers decreasing
over the years (See Figure 9.11, Appendix 9.6 and Appendix 9.7).
Economic Review 2014