Page 86 - economic review
P. 86

58

AGRICULTURE AND ALLIED SECTORS  Trend in Production

                                2.78 Estimates of the fishery resources assessment shows that among the maritime states in
                                India, Kerala occupies the second position in marine fish production. The total fish production in
                                Kerala during 2013-14 was 7.8 lakh metric tonnes. The marine fishery resources of the state has
                                almost attained the optimum level of production. At National level more than 64 per cent of the total
                                fish production is contributed by the inland sector. Government have approved a master plan for
                                increasing the inland fish production of the state from the current level of 75000 tonnes to 2 lakh
                                tonnes over a period of 10 years. The current level of Inland fish production is to the quantum of
                                about 1.86 lakh tones, an increase of 20 percent of the previous year. The species-wise inland fish
                                production in Kerala from 2010-11 to 2013-14 are shown in Appendix 2.41.

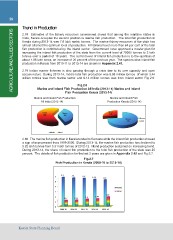
                                2.79 Indian marine fisheries is also passing through a crisis due to its over capacity and open

                                access nature. During 2013-14, India’s total fish production was 9.58 million tonnes of which 3.44

                                million tonnes was from marine sector and 6.14 million tonnes was from Inland sector Fig 2.6.


                                   		                                        Fig.2.6	

                                       Marine and Inland Fish Production All India (2013-14) Marine and Inland

                                                             Fish Production Kerala (2013-14)

                                   	 Marine and Inland Fish Production       		        	 Marine and Inland Fish
                                                    All Inida (2013-14) 			                Production Kerala (2013-14)

                                       Inland                Marine                      Inland
                                        64%                   36%                         26%

                                                                                                                                          Marine  Marine
                                                                                                                                            74%   Inland

                                                                                 Marine Inland

                                2.80 The marine fish production in Kerala tended to fluctuate while the inland fish production showed
                                a sign of improvement from 1999-2000. During 2013-14, the marine fish production has declined to
                                5.22 lakh tonnes from 5.31 lakh tonnes of 2012-13. Inland production sustained on increasing trend.
                                During 2013-14, the share of inland fish production to the total fish production of the state was 26
                                percent. The details of fish production for the last 5 years are given in Appendix 2.42 and Fig 2.7.

                                                                                             Fig.2.7
                                                                 Fish Production in Kerala (2009-10 to 2013-14)

                                               6 5.7                 5.6 5.53 5.31 5.22
                                               5

                                               4                                                                                  Marine
                                                                                                                                  Inland
                                               3
                                                                                                                            1.86

                                               2 1.17 1.21 1.4 1.49

                                               1

                                               0
                                                      2009-10 2010-11 2011-12 2012-13 2013-14

                                Kerala State Planning Board
   81   82   83   84   85   86   87   88   89   90   91