Foreword
Infrastructure
Road Accidents
Even though several initiatives have been taken by the Police to enforce road discipline and enforcement of rules by Motor Vehicles Department, road accidents are increasing. The increasing trend of traffic accidents is a matter of great concern. The analysis of figures from 1980-81 onwards shows that an increase in the number of accidents was steady from 7064 in 1980-81 to 20,900 in 1990-91 and 34,387 in 2000-01 and 35282 in 2010-11 to 39,137 in 2015-16. Even bigger states like Uttar Pradesh, Gujarat and Rajasthan report far less number of accidents compared to Kerala. The district wise motor vehicle accidents in Kerala and the category wise details of motor vehicles involved in road accident are given in Appendix 5.11 and Appendix 5.12 respectively.
During 2015-16, Kerala registered 39137 accidents (107 per day). Accidents due to KSRTC buses were 1330 (4 per day) against 5686 buses and private buses were 3303 as against 25449 (9 per day). The number of two wheelers has increased from 58.29 lakh in 2015 to 64.72 lakh in 2016, recording average annual growth rate of 11 per cent. Similarly the number of traffic crashes involving two wheelers has grown from 29,963 (82 per day) in 2015 to 31595 (87 per day) in 2016. Bike accidents account for nearly 52 per cent of the total accidents reported in the State. Trend of Motor Vehicle Accidents in Kerala is presented in Figure 5.3.
Fig 5.3
Trend of Motor Vehicle Accidents in Kerala
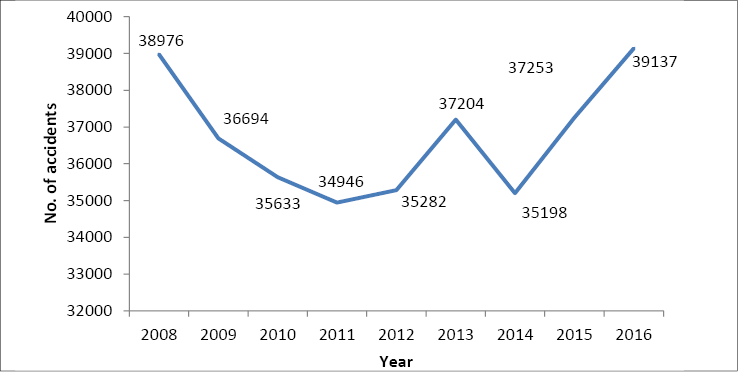
Source: State Crime Records Bureau
Kerala recorded a total of 39137 accidents in the year 2016 which is 385 accidents per lakh vehicles registered in the State. Growth of accidents in the State during the last seven years is given in Table 5.6. It can be seen that the accident occurrences have exhibited fluctuation during various time periods without showing any definite growth or decline pattern.
Table 5.6
Accident Trend in Kerala during 2010 -2016
| Year | No. of Motor Vehicles | No. of Accidents | Accidents/ lakh vehicle | 2010 | 53,97,652 | 35,633 | 660 | 2011 | 60,72,019 | 34,946 | 576 | 2012 | 68,70,354 | 35,282 | 514 | 2013 | 80,48,673 | 37,204 | 462 | 2014 | 85,47,966 | 35,198 | 412 | 2015 | 94,21,245 | 37,253 | 395 | 2016 | 1,01,71,813 | 39,137 | 385 |
Source: Motor Vehicles Department and State Crime Record Bureau
Most of the accidents are attributed to fault of drivers as per records available with Traffic Police. However, deficiencies in road design as well as motor vehicles apart from bad road conditions also contribute to the road accidents which are generally overlooked. Road safety training for various categories of road users, rectification of road design, deficiencies and inclusion of road safety aspects in the planning and operation stages of road construction are the primary needs to be taken up in reducing accident occurrences.
The per centage of vehicle category wise accidents in Kerala during 2015-16 is shown in Figure 5.4.
Figure 5.4
Distribution of road accident by vehicle type in Kerala during 2015-16
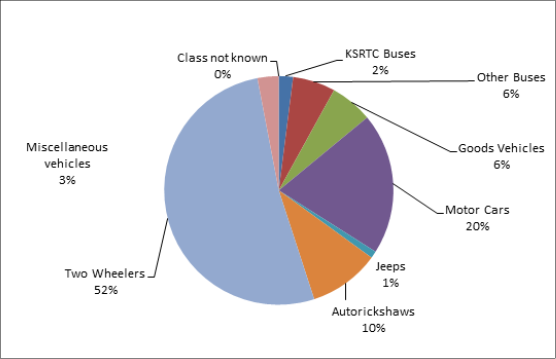
Source: State Crime Records Bureau
Kerala State Road Transport Corporation (KSRTC)
Kerala State Road Transport Corporation (KSRTC) is the single largest public sector undertaking, which carries out passenger transport operations in the State. The gross revenue earning of KSRTC during 2015-16 is 2,165.16 Crore. The gross revenue expenditure is 2,778.30 Crore and operating loss during this period is 613.14 Crore.
Out of 5686 buses of KSRTC, 1095 (19 per cent) buses are ten or more years old. The worn out status of KSRTC buses are given in Appendix 5.13. The average earning per vehicle on road per day of the Corporation has increased from 10,928 in 2014-15 to 11,191 during 2015-16. During the period, 609 new buses were put on road and 579 buses were scrapped. The Corporation operated its bus service to a distance of 5870.11 lakh km and about 10137.76 lakh passengers travelled in KSRTC buses during this period. The major indicators showing operational efficiency and district wise operational statistics of KSRTC/KURTC are given in Appendix 5.14 and Appendix 5.15 respectively.
The fare structure of KSRTC remained unchanged during 2015-16. The fares of ordinary and city buses are 64 paise per Km, 72 paise per Km for super fast, 90 paise to super deluxe service, 110 paise for A/C Air Bus and 130 paise for High Tech Volvo Buses. The fare structure of KSRTC is given in Appendix 5.16.
Inter Unit analysis of KSRTC reveals that about 30 per cent of the units of the State exhibit poor performance. The unit wise details of operational statistics are given in Appendix 5.17. Financial performance of KSRTC is not in tune with its physical achievements due to increase in operating expenditure, hike in pension commitments, increase in interest payments, operation in uneconomic routes and granting concessional travels leading to increasing losses to the Corporation.
Though the occupancy ratio in KSRTC has increased from 67.14 per cent in 2009-10 to 75.09 per cent in 2014-15, it is not appreciable considering the higher occupancy in private carriages and the poor road infrastructure in Kerala which results in lesser use of private modes of transport. Private operators are dominant in passenger transport operation in the State. Fleet utilization of KSRTC is only 81 per cent. More than 12 per cent of the buses are under repair and 25.9 per cent of the vehicles are over aged. Staff per bus ratio is as high as 7.2. The number of breakdowns per lakh kilometers in KSRTC is around 6 while that of neighboring Karnataka RTC (KnRTC) and Bangalore Metropolitan Transport Corporation (BMTC) are less than one. The number of buses owned by KSRTC is given in Appendix 5.18. The major internal Indicators of KSRTC is given in the Box.
Major internal Indicators of KSRTC
- Average Fleet held 5686
- Average Fleet operated 4522
- Average age of Fleet (Years) 7
- Over aged vehicles 25.9 per cent
- Staff strength 40988
- Staff per bus ratio (fleet held) 7.2
- Staff per bus ratio (fleet operated) 9.1
- Staff productivity (Km/staff/day) 37.01
- Fuel efficiency (Km/litre of HSD) 4.22
- Occupancy Ratio 75.09 per cent
Source: KSRTC
and the major physical achievements of KSRTC during 2015-16 are provided in the Box.
Major achievements of KSRTC
- KSRTC has started two new operating centers at Anayara and Nedumangad
- Agreements were executed among the Chief Executives of the STUs of Andhra Pradesh, Thelungana, Goa and Puducherry for Interstate service operation
- Rolled out 615 nos of new buses for replacing old buses
- KSRTC has purchased 18 nos of new Scania A/c Multi Axle buses for interstate service operation
- Started new Silver Line Jet buses for long distance services with push back seat and WiFi facility
- Taken over 204 Super class services from private operators
- Installed GPS system in 474 Super class buses attached to Thiruvananthapuram Central, Thiruvananthapuram City and Kottayam Depots
- KURTC, a subsidiary corporation of KSRTC has rolled out 65 nos of A/c Low floor buses and 173 non A/c Semi Low floor buses
- Constructed Bus Terminal Cum Shopping Complexes at different bus stations
- Training was given to 12113 employees at Staff Training Centre, KSRTC, which includes newly recruited drivers, conductors and other staff.
Source: KSRTC
Heavy losses due to operational inefficiency, high bus/staff ratio, operation in uneconomic routes and unviable depots are some of the issues/challenges faced by KSRTC. A professional techno economic study needs to be done to identify and suggest measures to deal with the critical issues/challenges faced by KSRTC.
Goods Transportation
Inter –state goods movements are handled predominantly by road based good carriers, followed by rail and waterways. As per a recent study by NATPAC, the share of road is 78 per cent, water transport 14 per cent and movement by rail is 8 per cent. A study by erstwhile Planning Commission (2008) reveals that the Road transport carry almost 88 per cent of total traffic, while Railways handled about 10 per cent of total traffic and Water transport carried less than 2 per cent of cargo movement. Once the National Waterway No.3 (Kottappuram – Kollam) becomes operational, 20 per cent of the road based cargo traffic is expected to shift to water transport.
Way forward
Road crashes can be prevented by better planning and more safety-conscious design of the road network. Road infrastructure including road surface, road signs and roadway design is a significant safety factor. Unsafe road infrastructure is a critical root cause of road crashes in some occasions. Even some low-cost infrastructure improvements can substantially reduce the occurrence of road crashes and their severity.
Proper surface water drainage, road signage, road markings, street lighting, and road side appurtenances have vital role in enhancing road safety. The design of each of these elements of road infrastructure has to be based on IRC guidelines and other code of practices available. Usually the road maintenance is limited to fixing potholes and cleaning drainage facilities, without replacing missing traffic signs, guard-rails, road markings and other safety features essential to create a safe road network.
Government is taking several initiatives to reduce the annual frequency of accidents by 50 per cent by 2025. For this purpose, the following key areas are identified to be resolved in a mission mode basis:
- Inter-departmental Coordination and Management
- Crash Data Collection and Management System
- Safer Road Infrastructure
- Legislations and Enforcement of Rules and Regulations
- Emergency Medical Response to Crash Victims
- Ensuring Safer Drivers through continued education including Bus drivers
- Ensuring Safety of Vulnerable Road Users
- Parking Policy
Road safety cannot be the responsibility of government alone. The insurance sector, service organizations and NGOs play an important role in promoting road safety awareness. NGOs have an important role at grass roots level. There are no segregated bus bays in most of the transport corridors, and buses stop in the carriageway itself resulting in traffic hold ups. Concerted efforts are needed to provide sheltered bus stops and passenger amenities to the commuters in all bus transport corridors.