Foreword
Infrastructure
Energy
Energy plays a vital role in the socio-economic development and human welfare of a State. Efficient, reliable and competitively priced energy supply is a prerequisite for accelerating economic growth and human development. Apart from its contribution to economic development, it contributes significantly to revenue generation, employment, enhancing the quality of life and reducing poverty. Making available the required quantity of power of acceptable quality at affordable price is one among the prime responsibilities of Government. For any developing country, therefore the strategy for energy development is an integral part of the overall economic strategy.
More recently, the need to reduce greenhouse gas emissions, especially carbon dioxide has emerged as one of the significant challenges in the power sector. The imperative need for climate change mitigation measures is only set to grow in the years to come. To meet this challenge, the emphasis on non-fossil fuel sources of energy, especially the renewables, wind and solar, has increased dramatically in the last few years.
Power Sector in India
In India, thermal energy is the predominant source of energy. It constitutes nearly 70 per cent of the total installed capacity of the country. Contribution of energy generation from different sources to the national grid, in per centage as on September 30, 2016 and the changes compared to the previous year is given in Table 5.8. The total installed capacity of power in India is 3, 06,358 MW. One major development during this period has been that renewable sources have emerged as the second largest energy source of the country leaving hydro to the third position. In the sector wise breakup of total energy generation, the contribution of State sector is 1,02,089.9 MW (33 per cent), Central sector is 76,312 MW (25 per cent) and Private sector is 1,27,956 MW (42 per cent).
Table 5.8
All India Installed Capacity as on September 30, 2016
| Fuel | Installed Capacity (MW) (as on 30/9/15) | Per centageof installed capacity | Installed Capacity (MW) (as on 30/9/16) | Per centageof installed capacity | Per cent change compared to previous year | (1) | (2) | (3) | (4) | (5) | (6) | Thermal | 194200 | 69.68 | 213228.90 | 69.60 | 9.79 | Hydro | 42283 | 15.17 | 43112.43 | 14.07 | 1.96 | Nuclear | 5780 | 2.07 | 5780 | 1.89 | - | Renewable Sources | 36,471 | 13.08 | 44236.92 | 14.44 | 21.29 | Total | 278734 | 100.00 | 306358.25 | 100.00 | 9.91 |
Source: Figures in Column 2 and 4 are from Ministry of Power, Govt. of India and figures in Column 3, 5, 6 have been calculated
It can be seen from the table that among the energy sources, renewable sources recorded the highest percentage growth (21.29 per cent) compared to its previous year. It may be noted however that in terms of actual energy supply, the increased contribution of renewables will be less since the plant load factors of various renewable sources are much lower than thermal or hydel.
Power Sector in Kerala
Kerala generates power from four sources - hydro power, thermal power, wind power and solar power. Of these, hydel and thermal power generations account for the considerable majority whereas wind and solar power generations make only marginal additions. Monsoon is essential to sustain the hydropower base in the State and the shortage in rainfall usually creates a power crisis. Yet hydel energy is the most reliable and dependable source of energy in Kerala. In addition to these considerations, hydel is also not a source of greenhouse gas emissions and is effectively a renewable energy source, even if this is not fully reflected in the official classification of what renewables sources are.
The main challenges faced by the energy sector in the State are i) Inadequate capacity addition over the years leading to massive in house demand supply gap ii) Hydel power dominated supply scenario iii) Negligible share of renewable energy in the energy mix iv) Gap between energy conservation potential and its realization v) Limited presence of Independent Power Producers (IPP) and Co-Generating Stations (CGS) and vi) Limited penetration of star labeled products.
However on the positive side, the development of the power grid at the regional and national level has allowed States like Kerala to purchase a large proportion of its power from sources and producers outside the State. Thus in house capacity addition does not carry the same significance as before. The new challenge is to be able to find an adequate basket of sources, suitably distributed over time and hours of the day, with advance purchase agreements so that the net cost of purchased power is suitably optimised.
Despite public enthusiasm for renewable energy and the keen interest of government in the matter, renewable energy capacity installation and generation has fallen below the anticipated levels. This points to the need to overcome various constraints in the growth of renewable capacity as well as the need for a shift in emphasis in the development of renewable energy.
Box 5.8
Constitution of 19th Electric Power Survey Committee
Government of India vide order CEA/PLG/DMLF/PS/2/19EPS/2014 dated June 11, 2015 has constituted the 19th Electric Power Survey Committee to forecast State/Union Territory wise, Region wise & All India Electricity demand on short, Medium and long term as a foremost planning exercise to base subsequent planning activities in the country. Terms of reference of the Committee include (1) To forecast the year wise electricity demand projection for each State, Union Territory, Region and All India in detail up to the end of 13th plan and (2) To project the perspective year wise electricity demand for 14th plan i.e. from 2021-22 to 2026-27 and the terminal years of 15th &16th Five Year Plans i.e., year 2031-32 & 2036-37. The committee will submit its report in a period of 15 months.
Source: Central Electricity Authority, Ministry of Power, Govt. of India.
Capacity Addition during 2015-16
Total installed capacity of power in the State as on March 2016 is 2880.20 MW. Of which, hydel contributed the major share of 2104.3 MW (73.06 per cent); while 718.46 MW was contributed by thermal projects, 43.27 MW from wind and 14.15 MW from Solar. Figure 5.9 highlights the total installed capacity of Kerala from hydel, thermal and renewable sources.
Figure 5.9
Total Installed Capacity
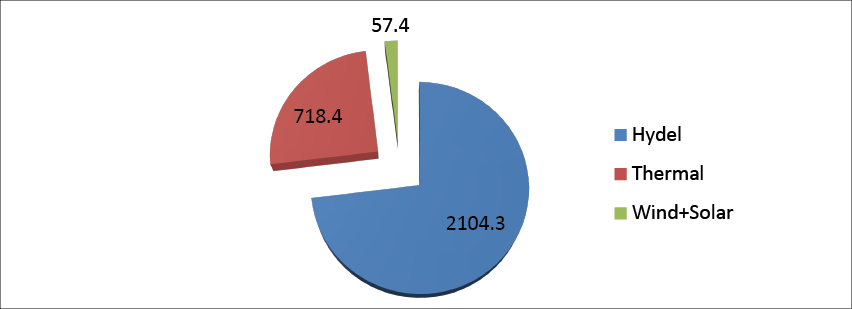
Source: KSEBL
The total additional capacity added from all sources during 2015-16 was 44.5 MW and scheme wise addition details are presented in Table.5.9.
Table 5.9
Capacity Addition, 2015-16
| Sl.No | Name of Power stations | Installed Capacity (MW) | Date ofcommissioning | Hydel | Solar | Wind | 1 | Chimmony HEP | 2.5 | 22.05.2015 | 2 | Adyanpara HEP | 3.5 | 03.09.2015 | 3 | Barapole HEP | 15 | 29.02.2016 | 4 | Peringalkuthu HEP (capacity enhancement) | 1 | 29.5.2015 | 5 | Solar Kanjikkode | 1 | 20.08.2015 | 6 | Solar Power Project at Chalayoor Colony, Agali | 0.096 | 31.8.2015 | 7 | Solar Power Project at Peringalkuthu Power House | 0.05 | 10.9.2015 | 8 | Solar Power Project at Banasurasagar,Wayanad | 0.01 | 21.01.2016 | 9 | Wind Power Project by M/s. Ahali Alternate Energy Pvt Ltd (IPP) | 8.4 | 22.02.2016 | 10 | Solar Power Project by M/s. CIAL (IPP) | 13 | 18.08.2015 | Total | 22 | 14.156 | 8.4 |
Source: KSEBL.
In the reference year 2015-16, 22 MW from Hydel source, 14.16 MW from Solar and 8.4 MW from wind was added to the installed capacity of the State although it is produced by different agencies.
Appendix 5.24 shows the details of energy source and its installed capacity during the last five years while sector wise details are shown in Appendix 5.25. Of the total installed capacity of 2880.20 MW during 2015-16, the contribution of State sector is 2209.2 MW (76.7 per cent), Central sector 359.6 MW (12.4 per cent) and Private sector 311.31 MW (10.8 per cent).The details of power availability during the last five years are shown in Appendix 5.26.
Kerala's Power Sector Projections
For power sector projections, the energy demand was presumed to be the basis with load factor being used to convert the projected energy demand to peak MW demand. The projected energy demand was worked out by a combination of end use and time series analysis. This was the methodology used in the Electric Power Surveys (EPS) conducted by Central Electricity Authority (CEA) in conjunction with the State Electricity Boards. Table 5.10 shows the Peak load and Energy Requirement projected in the 18th EPS and its variations with actuals.
From the Table 5.10 it can be seen that Maximum Demand and Energy Requirement of the State has not reached to the figures projected in the 18th EPS and there is considerable variations when compared to the realized actual figures.
Table 5.10
Electric Power Survey ( EPS ) Projections and realizations
| Year | Peak Load (MW) projected as per 18th EPS | Maximum Demand realized (Per cent Variance) | Energy Requirement (MU) projected as per 18th EPS Requirement (MU) projected as per 18th EPS | Energy requirement realized (Per cent Variance) | (1) | (2) | (3) | (4) | (5) | 2014-15 | 4157 | 3602(-13.3 per cent) | 23554 | 21914(-6.9 per cent) | 2015-16 | 4386 | 3860(-11.9 per cent) | 24975 | 22583(-9.5 per cent) | 2016-17 | 4669 | 26584 |
Source: Figures in Col.2&4 are from Economic Review 2014 and Figures in Col. 3 and 5 are from KSEBL
Performance of Power Sector Agencies
Power development activities in the State are carried out mainly through four agencies viz, Kerala State Electricity Board Limited (KSEBL), Agency for Non-conventional Energy and Rural Technology (ANERT), Electrical Inspectorate and Energy Management Centre (EMC). The Outlay and Expenditure of these departments for the last two years of the 12th Plan are shown in Table 5.11.
Table 5.11
Outlay and Expenditure, in lakh
| Sl.No | Department | Annual Plan 2015-16 | Annual Plan 2016-17 | Outlay | Expenditure | Per cent of Exp | Outlay | Expenditure* | Per cent of Exp | 1 | KSEBL | 140942 | 105005.35 | 74.50 | 156412 | 68,378.42 | 43.72 | 2 | ANERT | 4280 | 2107.71 | 49.25 | 4388 | 2.41 | 0.05 | 3 | MTSL | 560 | 354.82 | 63.36 | 730 | 1.63 | 0.22 | 4 | EMC | 938 | 751.21 | 80.09 | 740 | 230.98 | 31.21 | Total | 146720 | 108219.09 | 73.76 | 162270 | 68,613.44 | 42.28 |
Source: Plan space* Expenditure as on December 5, 2016
Kerala State Electricity Board Limited (KSEBL)
KSEBL is one of the driving forces behind the economic development of the State of Kerala. It has been responsible for the generation, transmission and supply of electricity in the State, with particular mandate to provide electricity at affordable cost to the domestic as well as for agricultural purposes.
In order to comply with the provisions of Electricity Act 2003 and the Government of India directives, the Kerala Government notified a transfer scheme vide GO (M.S) No.37/2008/PD dated, 25.9.2008 through which all assets and liabilities of KSEB were vested with the State Government. The assets and liabilities were revested with fully owned government company, KSEB Limited under the Indian Companies Act, 1956 on 14th January 2011.