Unemployment Situation in Kerala
The World Employment and Social Outlook Report, 2017 published by International Labour Organisation (ILO) points out that global unemployment levels and rates are expected to remain high in the short term, as the global labour force continues to grow. In particular, the global unemployment rate is expected to rise modestly in 2017 to 5.8 per cent from 5.7 per cent in 2016. Regarding Indian situation, the Report cites that India’s economic growth trends are lagging behind employment needs and predicts both rising unemployment and worsening social inequality throughout 2017. Job creation in India is not expected to pick up pace in 2017 and 2018 as unemployment rises slightly, representing a near stagnation in percentage terms. Unemployment in India is projected to increase from 17.7 million in 2016 to 17.8 million in 2017 and 18 million in 2019. In percentage terms, unemployment rate will remain at 3.4 per cent in 2017-18.
Job creation has been a matter of serious concern in Kerala. This is manifested most notably in a very pronounced incidence of unemployment which is more than two times the all-India average. unemployment retards the economic development of the State and creates social unrest. This problem is more serious among the educated who are unable to utilise their skill and knowledge which they have acquired for effecting qualitative changes in the economy and society. The Government has to frame appropriate policies to utilise the skilled manpower, which is the most abundant resource in the State.
According to the Fifth 5th Annual Employment-Unemployment Survey 2015-16 conducted by Ministry of Labour and Employment, Government of India, Labour Force Participation Rate (LFPR) at all India level is estimated at 50.3 per cent under Usual Principal Status Approach (UPS). Female’s LFPR is significantly lower compared to males. At all India level, female LFPR is 23.7 per cent as compared to 75 per cent for male and 48 per cent for transgenders. Similarly, the Worker Population Ratio (WPR) at all India level is estimated at 47.8 per cent comprising 27.7 per cent females, 72.1 per cent males and 45.9 per cent for trasngenders. According to the survey report, among major States Kerala has the highest Unemployment Rate (UR) of 12.5 as against the all India level of 5 per cent (Appendix 4.1.52 and Figure 4.1.5). Among all States, only tiny States of Sikkim and Tripura have a higher unemployment rate than Kerala.
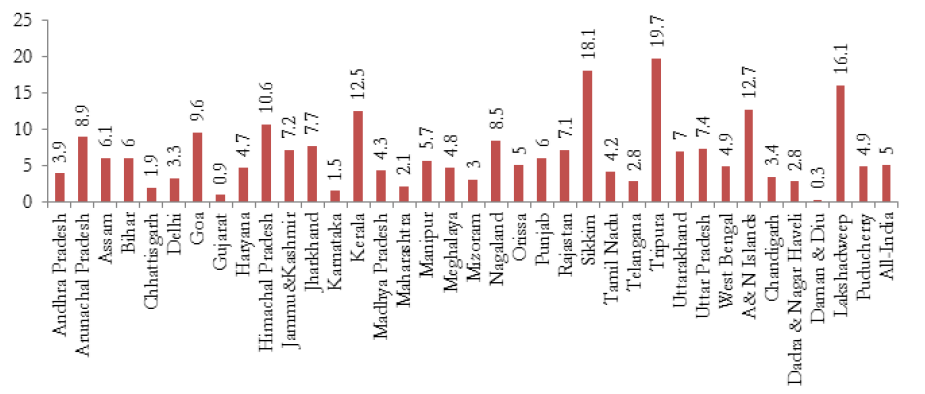
Source: Fifth Annual Employment-Unemployment Survey 2015-16),Government of India.
As per UPS approach, the lowest unemployment rate of 0.3 per cent is estimated in Daman and Diu (UT). Among the States, the lowest unemployment rate is estimated in Gujarat (0.9 per cent).The other major States, which have lower UR than the all India average (5 per cent) are Karnataka (1.5 per cent), Chattisgarh (1.9 per cent), Maharashtra (2.1 per cent) Madhya Pradesh (4.3 per cent), Andhra Pradesh (3.9 per cent), Tamil Nadu (4.2 per cent) and West Bengal (4.9 per cent).
The unemployment rate, defined as a proportion of the number unemployed to the total labour force (15−60), is measured in terms of usual status, weekly status and daily status. While usual activity status implies regular unemployment, both weekly and daily status represent seasonal/temporary unemployment. Figure 4.1.6 shows the male and female unemployment rate in Kerala in rural and urban areas as measured by different approaches. In all three approaches, unemployment in Kerala is found to be generally three to four times greater than the all India average. The unemployment rate of Kerala under UPS approach is 9.8 per cent, which is a more authentic figure as it is prepared with more scientific basis by NSSO. Female unemployment, particularly in rural areas, is a matter of concern in Kerala. However, the female LFPR in Kerala is estimated at 30.8 per cent which is higher than the all India level of 23.7 per cent. Different indicators on employment and unemployment pertaining to Kerala and India are shown in Appendices 4.1.53 and 4.1.54 As per the survey of Employment and Unemployment Situation in India, (NSS 68th Round), area wise data shows that the unemployment rate is higher in rural areas as compared to urban areas (Figure 4.1.6).

Source: Employment and Unemployment Situation in India, NSS 68th Round, July 2011- June 2012(Age: 15-59 years)
Productive employment of youth is an essential factor for economic development. In Kerala, the youth accounted for around 23 per cent of the State’s population. As per the survey report, the UR among the youth in Kerala is much higher as compared to that of the overall population and it reveals the severity of unemployment problem among the youth in Kerala. The UR of the youth is 21.7 per cent for rural areas and 18.0 per cent for urban areas. Similarly, the UR among the female youth is also much higher than that of the male youth. Area wise UR data shows that 47.4 per cent of female are unemployed in rural area as against the male unemployment rate of 9.7 per cent. (Figure 4.1.7). Youth unemployment is prevalent in Kerala because young people lack adequate skills, work experience etc in emerging areas. In order to face the challenges, the ongoing programmes for skill development and employment generation may be restructured to equip the youth for finding better employment opportunities.
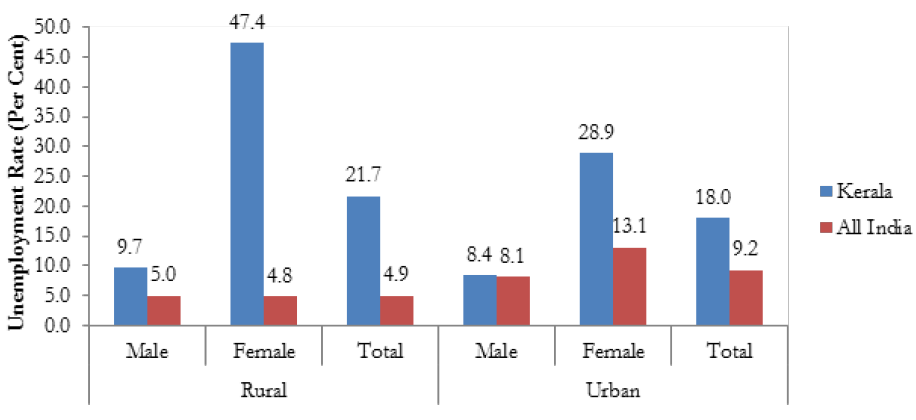
Source: Employment and Unemployment Situation in India, NSS 68th Round, 2011- 2012 (Age: 15-29 years)
One of the interesting features of Kerala is that women are found to be well educated. However, similar to LFPR, the worker population ratio of females is much lower as compared to that of male. WPRs based on the different approaches for both male and female is presented in Figure 4.1.8.
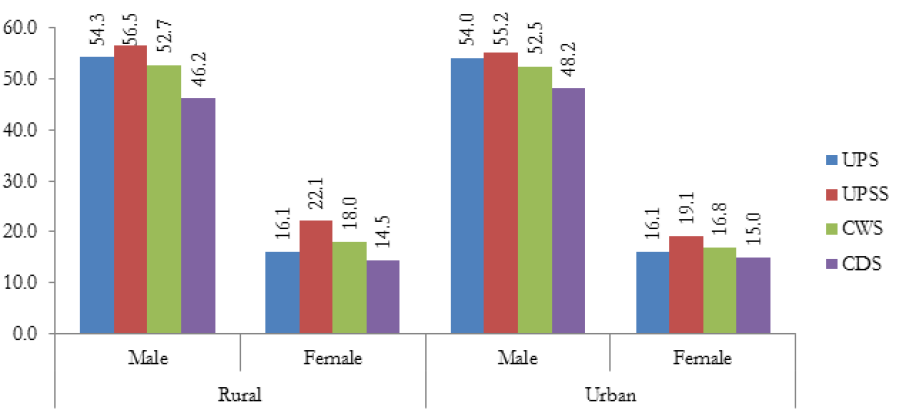
Source: Employment and Unemployment Situation in India, NSS Report No. 554 (NSS 68th Round, July 2011- June 2012)
Data on age specific WPR (UPSS approach) indicates that in the rural area highest participation of workers was in the age group of 40-44 years (male – 97.8 per cent, female – 47.0 per cent); whereas in the urban area highest participation was in the age group of 35-39 years (male – 96.6 per cent, female – 39.6 per cent). Figure 4.1.9 gives a diagrammatic presentation of the age specific WPR for the different categories of persons.
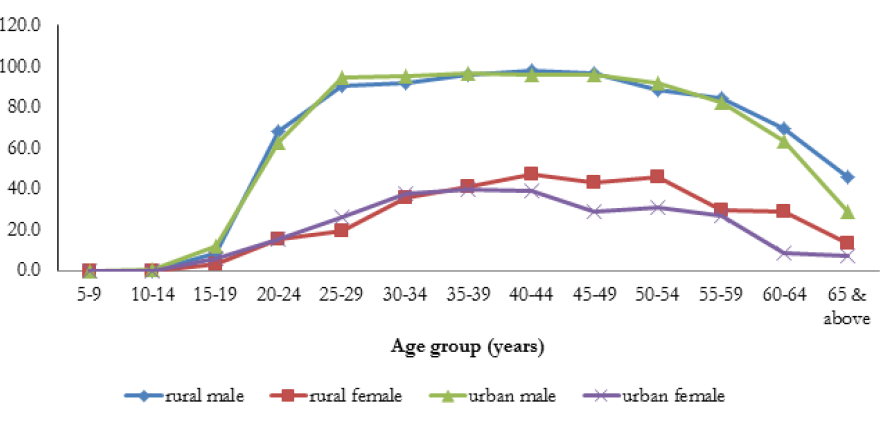
Source: Employment and Unemployment Situation in India, NSS Report No. 554 (NSS 68th Round, July 2011- June 2012)
Employment in the Organised Sector
In Kerala, employment in the organised sector has remained more or less stagnant, showing only a marginal increase from 11.15 lakh in 2010 to 11.73 lakh in 2017. The reason behind this trend is due to the movement of labour force to the informal sectors like construction, real estate, textiles communication etc, which provides more employment.
The organised sector comprises private and public sectors and it is noteworthy that private sector employment is steadily increasing since 2011 onwards. In 2017, out of 11.73 lakh persons employed in the organised sector 5.60 lakh (48 per cent) are in the public sector and 6.13 lakh (52 per cent) are in the private sector. (Appendix 4.1.55 and Figure 4.1.10).
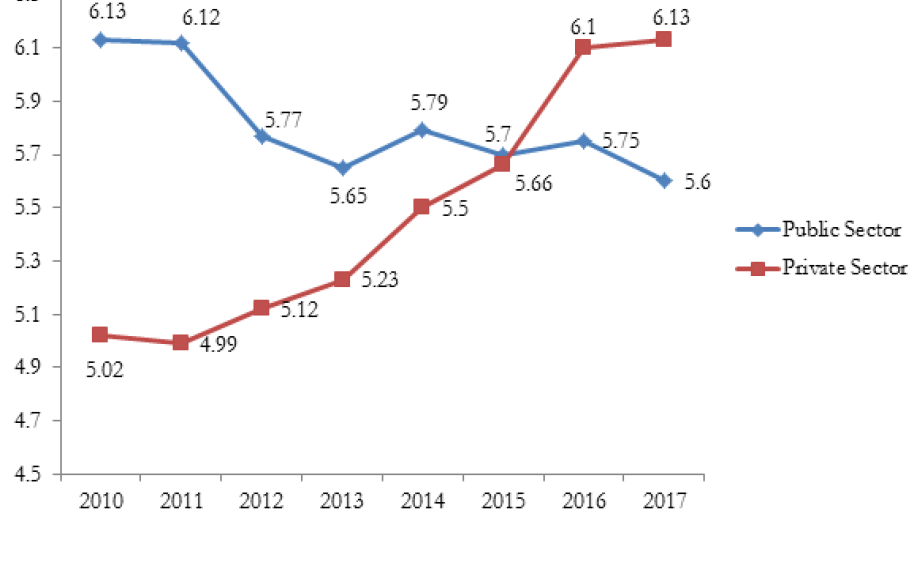
Source: Directorate of Employment, Govt. of Kerala, 2017
Within the public sector employment, 46.2 per cent are employed in State Government and 10.5 per cent are in Central Government, 23.7 per cent are in State quasi institutions, 4.6 per cent in LSGI and 14.8 per cent are in Central quasi institutions. (Figure 4.1.11 and Appendix 4.1.56).
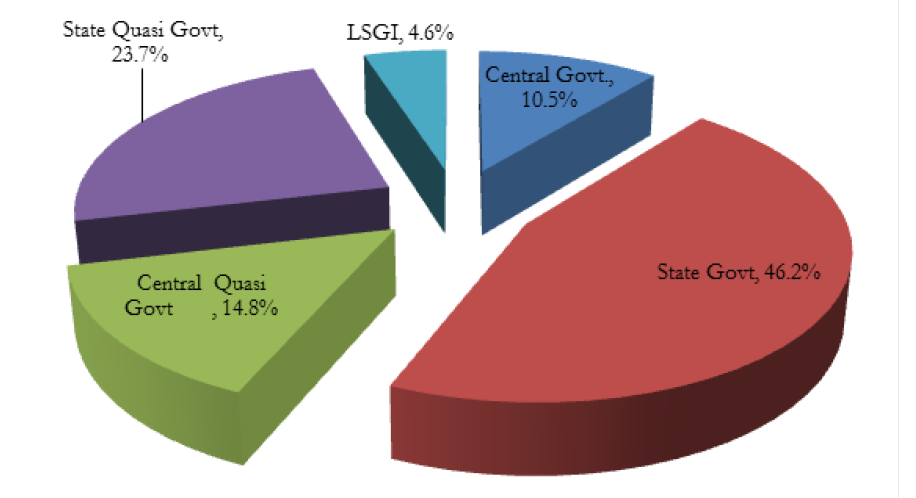
Source: Directorate of Employment, Govt. of Kerala, 2017
Data on district-wise employment as on March 2017 indicate that Ernakulam and Wayanad are the two districts which respectively accounted for the highest and lowest employment. Total organised sector employment in Ernakulum District is 1.89 lakh persons, which accounted for 16 per cent of the total employment of the State. Whereas in Wayanad, the employment under organised sector is 34,915 persons, which accounted for 3 per cent of the total employment (Appendix 4.1.57). In Kerala, men outnumbered women in public sector employment and women outnumbered men in private sector employment. The share of males in public sector employment is 66 per cent while the share of females in total private sector employment is 52 per cent.
Recent statistics on industry wise distribution of workers in organised sector in Kerala indicates that the dependence on service sector continues to rise whereas the dependence on agriculture continues to decline. Employment in agriculture, relative to other sectors has fallen while the share of employment in manufacturing, education, and financial and insurance activities has risen. (Appendix 4.1.58 and Figure 4.1.12).
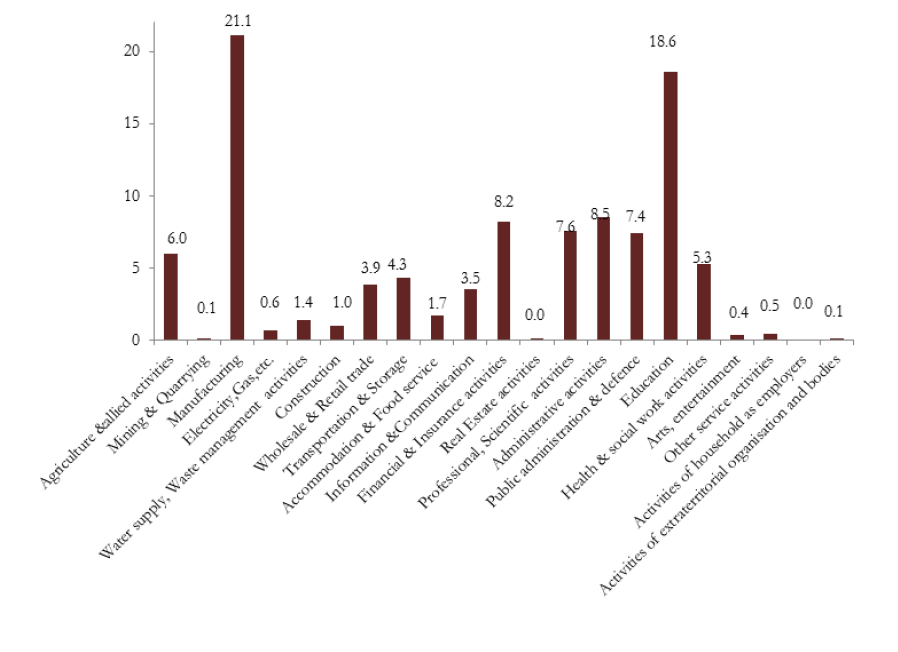
Source: Directorate of Employment, Govt. of Kerala, 2017
Employment in Unorganised Sector
Unorganised sector plays a crucial role in Indian economy in terms of employment and its contribution to the Gross Domestic Product, savings and capital formation. More than 90 per cent of workforce and nearly 50 per cent of the Gross Domestic Product are accounted from the sector. A high proportion of socially and economically weaker sections of society are engaged in the unorganised economic activities in India and Kerala. As per the employment and unemployment survey carried out by the NSSO (68th round) based on UPSS approach, it is estimated that self employed workers in Kerala constituted 37.7 per cent of the total workers. Comparatively, the percentage share of regular wage/salaried employee accounted for 22.5 per cent and that of casual labour accounted for 39.8 per cent.
Employees of enterprises belonging to the unorganised sector have lower job security, poorer chances of growth, and no leaves and paid holidays, lower protection against employers and indulgence in unfair or illegal practices. The unorganised workers are subject to exploitation and suffer from poor working conditions especially low wages which are much below that in the formal sector, even for closely comparable jobs. In Kerala, Directorate of Employment is the nodal department entrusted with the responsibility to take measures to reduce instances of unfair practices existing in the unorganised sector. In recent years the Kerala government has initiated several measures to provide social security to workers in the unorganised sector.
Skill and Unemployment
In Kerala rate of unemployment (persons who are unemployed as a percentage of Labour force) is noticeably higher for persons with university education than the rest. One fourth of post graduates in labour force are unemployed while one sixth of persons with technical degree and one sixth of persons with vocational training are unemployed. (Table 4.1.9)
| General Education | Rate of Unemployment | Vocational Training | Rate of Unemployment |
| Not Literate | 4.6 | Formal | 14.9 |
| Just Literate | 4.1 | Informal | 3.5 |
| Primary | 2.4 | No Training | 9.7 |
| Middle | 4.1 | Graduate | 16.2 |
| Secondary | 10.2 | Diploma | 20.3 |
| Higher Secondary | 18.8 | Post Graduate Diploma | 25.7 |
| Graduate | 20.0 | No Qualification | 7.7 |
| Post Graduate | 23.3 | ||
| Source: Computed from unit records of NSS 68th Round | |||
Employment Exchanges and their Services Registered Job Seekers
According to live register of employment exchanges in Kerala, the total number of job seekers as on December 31, 2012 was 44.99 lakh. But it has now declined to 36.83 lakh as on October 31, 2017, a reduction of about 8.16 lakh. Details of job seekers for various years are given in Appendix 4.1.59.
Contrary to the all India scenario, women job seekers are found to be more in the live registers in Kerala. Of the total job seekers, 60 per cent are women. Number of illiterate persons in the live register is 1291. Distribution of job seekers by educational level indicates that only 10 per cent have qualification below SSLC. About 62 per cent of the job seekers are in the category of qualifications having SSLC. (Appendix 4.1.60).
The number of professional and technical job seekers as on June 30, 2017 is 1.85 lakh. Data reveals that ITI certificate holders and Diploma holders in Engineering together constitute 97 per cent of the total professional and technical job seekers. There are 35,541 registered engineering graduates (Appendix 4.1.61).
A significant and peculiar feature of Kerala is that women outnumbered men who seek employment through employment exchanges. The district-wise job seekers in Kerala is shown in Figure 4.1.13.
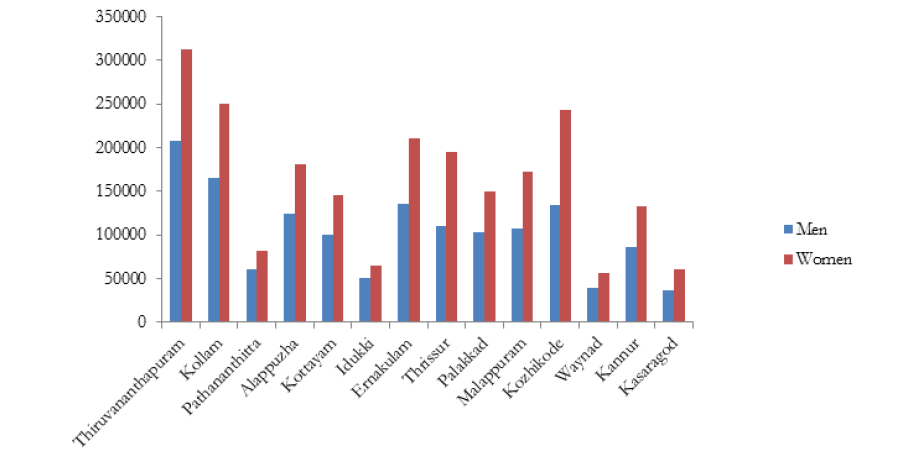
Source: Directorate of Employment, Govt. of Kerala, 2017
Thiruvananthapuram District ranks first in the number of job seekers in general and professional/technical categories as on June 30, 2017. The total number of job seekers in Thiruvananthapuram district is 5.19 lakh, of which 3.11 lakh are women and 2.07 lakh men. The second largest number of job seekers is in Kollam district with 4.16 lakh persons. The lowest number of job seekers registered in Wayanad district with 96,262 persons, followed by Kasargode District with 97,355 persons. (Appendix 4.1.62). The Department has initiated a separate scheme called Kaivalya, for the differently abled candidate registered in Employment Exchange (Box 4.1.7).
Kaivalya is a comprehensive employment rehabilitation programme introduced by Employment department of Kerala Government from November, 2016 for the upliftment of differently abled candidates who are the registrants of Employment Exchanges. The primary objective of the scheme is to create a social and physical environment favouring accessibility, integration and full participation of persons with disabilities. It comprises the following 4 components;
An amount of 168.00 lakh was spent in 2016-17 for implementing the above activities benefitting 505 persons. In 2017-18, an amount of 100 lakh has been sanctioned for 803 beneficiaries selected out of 4,111 applicants.
Self Employment Schemes Implemented through Employment Exchanges
Three self employment schemes are implemented through the Employment Exchanges in Kerala.
Unemployment Assistance
Government of Kerala had introduced an unemployment assistance scheme in 1982. Under the scheme, unemployed youths remaining in the live registers for over three years (for physically challenged two years) after attaining the age of 18 and having passed SSLC (For SC/ST and physically challenged, candidate need to have only appeared for SSLC examination) and having annual family income below 12,000 and personal income below 100 per month are eligible for an unemployment assistance of 120 per month up to the age of 35 years of age. With the enactment of the Kerala Panchayat Raj Act and Kerala Municipality Act, the unemployment assistance scheme was transferred to Rural and Urban Local Governments since 1998. Under the scheme, the eligible candidates shall submit their application for unemployment allowance in the prescribed form to the local government. The Welfare Standing Committee at the Local Governments may finalise the list of candidates based on the eligibility criteria. In the current year (as on October 2017), an amount of 21.58 crore was disbursed to 193,071 beneficiaries as unemployment assistance and 24 crore to 5,280 beneficiaries as self employment assistance.
Niyukthi is a standalone mega recruitment drive organised by the National Employment Service department with a view to providing employment opportunities to the educated and talented unemployed youth in the private sector. Niyukthi 2017 was organised in Thiruvananthapuram, Ernakulam and Kozhikkode in the months of January and February 2017. In this mega event, 24,824 job seekers and 252 employers participated. Out of 17,641 vacancies reported, 6,817 jobs were offered and 333 placements were provided.
Placement through Employment Exchanges in Kerala
The placement through Employment Exchanges in Kerala has been declining since 2010. Total placement has declined from 12,643 in 2010 to 10,212 in 2016 and further to 5,437 as on June 30, 2017. Reduction in placement may be due to temporary posts either being filled up on daily wage/contract basis or being kept vacant. The placement through employment exchanges in Kerala since 2010 is illustrated in the Figure 4.1.14.
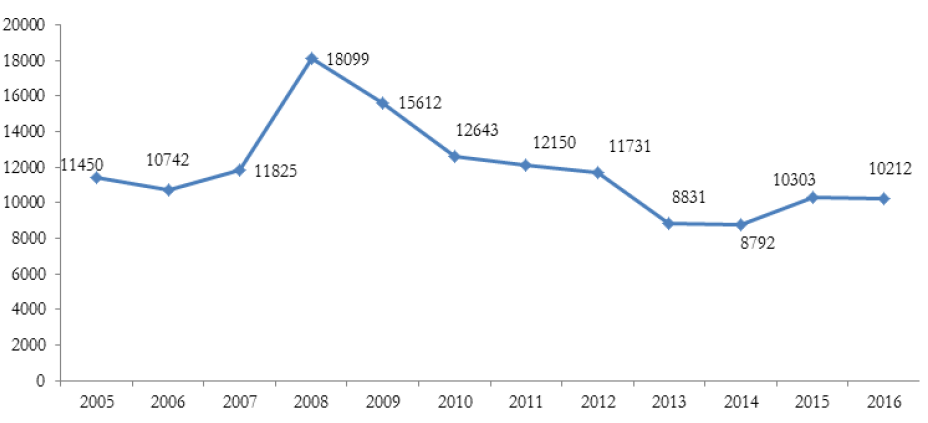
Source: Directorate of Employment, Govt. of Kerala, 2017