Chapter 3
INDUSTRY, LABOUR AND EMPLOYMENT
Introduction
In this chapter, issues concerning industry, labour and employment are grouped together to bring out the striking economic complementarities between labour and entrepreneurship. At the same time the need for development policy to ensure that there is no compromise on dignity of labour and decent work standards, while stimulating industrial growth is emphasized. Though inter-related, there are specific issues concerning each of these areas and the chapter is sub-divided into three sections viz. Industry , Labour and Employment.
As brought out in Chapter 1, manufacturing in Kerala has been growing at 13.5 percent in 2011-12 over the previous year, much higher than the 9.9 percent growth of this sector at the national level. Manufacturing in Kerala contributes 7.3 per cent to the State’s GSDP at current prices. The share of manufacturing to Kerala’s GSDP in 2011-12 is almost the same as the contribution of overall manufacturing to the Nation’s GDP. In the case of mining also, this sector contributes 0.6 % to the state’s GSDP, which is on par with the contribution of mining to the country’s GDP. Mining in Kerala has grown at 11 percent in current prices in 2011-12, while there was negative growth in mining at the national level. Section 3.1 includes the performance of State level Public Sector Enterprises (PSEs), Micro, Small and Medium Enterprises (MSMEs) and Traditional industries (Coir, Handloom, Cashew and Handicrafts) in recent years. It also provides an account of the mining sector in the state. The institutional structure in the state to promote industry is also brought out. The major challenges faced by these industries and some of the important schemes introduced to tackle these challenges are brought out in this section.
The State is on par with advanced countries in ensuring that interests of Labour are not compromised while striving towards economic growth. Kerala’s labour force is well aware of their rights and there is relatively high ethical standards and values in the labour market in Kerala. This chapter brings out highlights of various welfare measures recently undertaken for Kerala’s workers, which include a growing proportion of inter-state migrants. A section in this chapter is devoted to the growing unemployment problem in Kerala, where the work participation rate is the lowest among general category states in the country. Ensuring appropriate employment avenues to different categories of workers so that they enjoy a high standard of living continues to be a challenge.
.
Industry
Industrial slowdown has been all pervasive nation wide. The continuing recessionary trends in Europian Union, USA, Japan, coupled with infrastructural bottlenecks and high cost of credit has adversely impacted investment in new projects, thus clearly indicating a fall in business confidence.
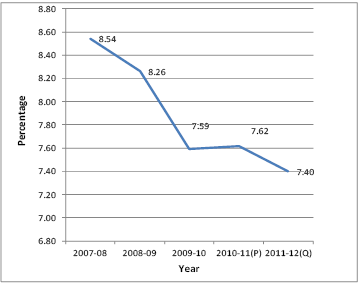
3.2 According to the latest estimates available on the Index of Industrial Production (IIP), the index of mining, manufacturing and electricity registered growth rates of 1.8 percent, 0.2 per cent and 2.8 per cent respectively during second quarter of 2012-13 as compared to the growth rate of (-) 4.1percent, 3.4 percent, and 10.5 percent in these industries in second quarter of 2011-12. The key indicators of construction sector, namely, cement production and steel consumption have registered growth rates of 5.1 per cent and 2.3 per cent respectively during second quarter of 2012-13. (CSO) In Kerala, the manufacturing sector recorded a decline in growth rate of nearly 13.5 per cent in GSDP at current prices during 2011-12 compared to the growth of almost 15 percent in the previous year. The contribution of income from manufacturing sector to GSDP at constant and current prices during 2011-12 is 7.4 per cent and 7.3 per cent respectively. The income from manufacturing sector to GSDP and its growth rates from 2007-08 to 2011-12 are given in Appendix 3.1. A drastic decline can be observed in the growth rate of manufacturing during 2009-10 and after that there was an increase and again declined during 2011-12. Fig.3.1 shows the contribution of manufacturing to GSDP during the 11th Plan period.
Fig.3.1
Contribution of Manufacturing Sector to GSDP at 2004-05 prices
3.3 An Industrial and Commercial Policy has been drafted in 2011.It aims to convert Kerala from a wage earning society to an entrepreneurial state.
Table 3.1
Plan Outlay and Expenditure (रin Lakh)
Sl. No. |
Sector/ Sub sector |
Annual Plan 2010-11 | Annual Plan 2011-12 |
Annual Plan 2012-13 |
||
Outlay |
Expenditure |
Outlay |
Expenditure |
Outlay |
||
1. |
Village & Small Enterprises |
|||||
i. |
Small-Scale Industries |
4038.00 |
2843.87 |
4060.00 |
2547.48 |
5505.00 |
ii. |
Commerce |
10.00 |
10.00 |
10.00 |
10.00 |
75.00 |
iii. |
Handicrafts |
227.00 |
1213.00 |
226.00 |
225.75 |
300.00 |
iv. |
Handloom & Powerloom |
5668.00 |
5519.02 |
5767.00 |
6541.98 |
6832.00 |
v. |
Coir Industry |
8205.00 |
10292.31 |
8205.00 |
8220.23 |
10070.00 |
vi. |
Khadi & Village Industries |
878.00 |
878.00 |
928.00 |
928.00 |
1210.00 |
vii |
Cashew Industry |
5200.00 |
5200.00 |
5200.00 |
4688.00 |
6500.00 |
vii |
Beedi Industry |
60.00 |
649.06 |
40.00 |
32.29 |
- |
viii |
Sericulture |
350.00 |
75.00 |
- |
- |
- |
Subtotal-VSE |
24636.00 | 26680.26 |
24436.00 |
23193.73 |
30492.00 |
|
2. |
Other Industries |
17100.00 | 29669.68 |
22030.00 |
15266.12 |
24067.00 |
3. |
Minerals |
162.00 |
1115.18 |
162.00 |
58.22 |
211.00 |
TOTAL : Industry & Minerals |
41898.00 | 57465.12 |
46628.00 |
38518.07 |
54770.00 |
|
Source: Finance Department, Govt. of Kerala
3.4 The total outlay on Industry and Minerals during 2011-12 was 11 percentage higher than that in 2010-11 and the total outlay during 2012-13 is 17 percentage higher than that of 2011-12.
State Level Public Sector Enterprises(SPSE)
3.5 SPSEs have played a crucial role in the manufacturing and service sector of the State. It is one of the largest employers in the organized sector. PSEs have established a strong foundation for the development of small, medium and ancillary industries.
3.6 Multi pronged strategies are being introduced to revive and revitalize the PSEs through systematic monitoring and Good Governance. Due diligence was carried out with updation of accounts. Government have been taking steps to restructure and revive the PSEs by a comprehensive policy initiative through up-gradation of technology, performance contract agreement, inter-PSE tie up, capacity building and effective Corporate Governance systems under the initiative of Restructuring and Internal Audit Board (RIAB) (www.riab.kerala.gov.in)
Box 3.1
State Level PSEs under Industries Department as on 31-3-2012
1. No. of PSEs - 44
2. Sector-wise PSEs - 9 in Textiles, 8 in Traditional and Welfare, 7 in
Chemical, 6 in Engineering, 4 each in Development
& Infrastructure and Electrical Equipments, 3 in
Electronics, 2 in Ceramics & Refractories and 1
in Wood & Agro based sectors
3. Profit Making Units - 20, mainly in Chemical, Development &
Infrastructure and Electronics
4. Loss Making Units - 24, mainly in Textiles and Traditional Industries
5. Total Turnover during 2011-12 - र 3148.22 crore
6. Net Profit during 2011-12 - र 245.8 crore
Source: RIAB
3.7 The performance trend of PSEs during the last 5 years are given in Appendix 3.2. During 2012-13 (up to October 2012) PSEs have recorded a turnover of र 1427.22 crore and a Net Profit of र 11.97 crore. The turnover and profit/loss of PSUs during 2011-12 are detailed in Appendix 3.3.
Joint Stock Companies
3.8 The total number of Joint Stock Companies in Kerala as on March 2012 is 19521 of which nearly 93 percent are private limited and 7 percent are Public Limited. During 2011-12, 2823 Companies were newly registered which included 2757 private limited and 66 public limited companies. Details of Joint Stock Companies working in Kerala are given in Appendix 3.4.
Industrial Financing
3.9 Kerala has been taking serious efforts to identify new industrial and infrastructural opportunities and to equip itself to meet the emerging challenges. The role of Government has changed from a provider to that of a facilitator for industrial investment.Some major financial institutions in the public sector are :
Kerala Financial Corporation
3.10 Kerala Financial Corporation was established as Travancore Cochin Financial Corporation on 1-12-1953 and in November 1956 the Corporation was renamed as Kerala Financial Corporation (KFC). The main objective of KFC is the rapid industrialisation of the State by extending financial assistance to Micro, Small and Medium Enterprises in manufacturing and service sectors. Corporation can give financial assistance for setting up of new Units and for the expansion / modernisation / diversification of existing Units in both manufacturing and service sectors.
3.11 Kerala Financial Corporation has achieved substantial growth in terms of sanction, disbursement and recovery of financial assistance and made an operational profit. The Corporation is the No. 1 State Financial Corporation in the country in terms of profitability and low level of Non Performing Asset. Corporation has earned the highest ever profit of र 45.65 crore during 2011-12. The non-performing assets are at the lowest level.
3.12 The Corporation sanctioned financial assistance of र 538.26 Crore during 2011-12 ( 6.3percent growth over previous year). An amount of र 464.57 crore was disbursed to various industrial units during financial year 2011- 12 (nearly 5 percent growth over previous year). The growth in the amount sanctioned and disbursed when compared to the previous year indicates healthy contribution of the Corporation to the development of the industrial activity in the State. Performance of working of KFC during the last 5 years is given in Appendix 3.5. The details of loan operations and industry- wise classification of loan during 2011-12 of KFC are shown in Appendix 3.6 and Appendix 3.7.
Kerala State Industrial Development Corporation (KSIDC)
3.13 Kerala State Industrial Development Corporation Ltd. (KSIDC) was formed in 1961 with the main objective of promoting, stimulating, financing, and facilitating the development of large and medium scale industries in Kerala.
3.14 KSIDC has sanctioned projects costing a capital investment of र 1255 crore with direct term loan assistance of र 216 crore in the year 2011-12. The new projects are expected to generate employment for 23,000 persons directly and indirectly. The Corporation has also registered an all time record of over र 39 crore profit before taxes (provisional), up 10.6 percent compared with last year, while the income hit the highest level of र 56.75 crore, recorded an increase of 8.8percent over the previous year. District-wise analysis shows that maximum employment was in the districts of Kozhikode and Ernakulam which accounted for 80percent of the employment generated in 2011-12. The details of investment and employment made in KSIDC Units during 2011-12 are given in Appendix 3.8.
3.15 Majority of projects financed by the Corporation during the year are from Tourism and Manufacturing sectors. Corporation has also sanctioned projects in IT sector, healthcare, logistics, infrastructure and Agro and food processing sectors. Government of Kerala has organized a mega investment mobilization event viz., Emerging, Kerala Global Connect 2012 and KSIDC was the nodal agency for conducting Emerging Kerala. As envisaged, the Emerging Kerala will be a biennial global connect programme and requisite steps are being taken to keep the momentum going.
Box 3.2
Major projects promoted by KSIDC for Industrial Development
1. Kochi – Palakkad NIMZ (National Investment Manufacturing Zone)
2. 1,200 MW Gas-based Power project at Cheemeni, Kasaragod,
3. Electronic Hardware Park at Kochi – a world class manufacturing and R & D
facility for Electronic sector,
4. Life Sciences Park for setting up state-of-the-art manufacturing and R & D
facility for Biotechnology, Nano technology, Contract Research etc.
5. Titanium Sponge Project at Kollam
6. Supplementary Gas Infrastructure Project
7. Coconut Industrial Park, Kuttiyadi
8. Organic Industrial Park, Kodungalloor
Source: KSIDC
3.16 The physical and financial performance of KSIDC during 2011-12 are furnished in Appendix 3.9.
Kerala Industrial Infrastructure Development Corporation (KINFRA)
3.17 Kerala Industrial Infrastructure Development Corporation (KINFRA) was set up by an Act of the State Legislature in February 1993, aiming at accelerating the industrial development of the State by providing infrastructure facilities to industries. The Industrial Parks developed by KINFRA have facilities like developed land or built up space, dedicated power, continuous water supply, communication facilities etc.
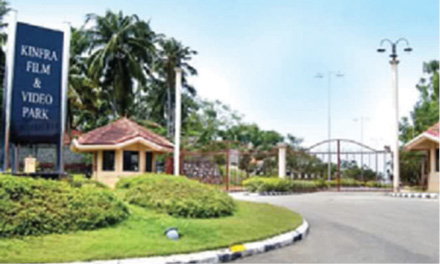
3.18 KINFRA has completed over the past 18 years, l4 theme based Industrial Parks in Kerala in areas such as garments, infotainment, marine/seafood, rubber, exports, food processing, etc. Some of the notable achievements are the successful completion of India’s first International Apparel Park at Thiruvananthapuram; India’s first Export Promotion Industrial Park at Ernakulam; India’s first Infotainment Park, the Film & Video Park at Trivandrum and India’s first Food Processing Industrial Park at Malappuram.
3.19 KINFRA has developed Joint Venture Projects like India’s first Rubber Park (a JVC with the Rubber Board) at Kochi, India’s first Seafood Processing Park (a JVC with MPEDA) at Alappuzha and Western India KINFRA Ltd. (a JVC with Western India Services & Estates ) at Palakkad.A Joint Venture Company between KINFRA and ICICI, known as I-KIN, has been set up to identify and facilitate the development of infrastructure projects in the State and another company between KINFRA and NTPC, Electrical Supply Co. Ltd. (KINESCO) for distribution of power to KINFRA Parks in the State.
3.20 KINFRA is the Nodal Agency for the Ministry of Food Processing Industries, Government of India (further details on Para 3.45 of this chapter). KINFRA is also acts as the nodal agency of the State for implementing “Assistance to States for Infrastructure Development of Exports and Allied Activities” (ASIDE) of Deparment of Commerce, Government of India. Government of Kerala has appointed KINFRA as the Nodal Agency for the National Institute of Fashion Technology (NIFT) at Kannur and land acquisition programme for Kannur Airport. The details of allotments in KINFRA Industrial Parks as on 30-09-2012 are given in Appendix 3.10.
Centre for Management Development
3.21 The Centre for Management Development (CMD) is a leading, self supporting autonomous institution established in 1979 under ACT XIII of the “Travancore-Cochin Literary, Scientific and Charitable Societies Act 1955” intended to provide Research, Consulting and Training Support to the Development Agencies, Corporate and the Government, at the national, state and local levels. During the year 2011-12 also, CMD undertook several research assignments for the Government of India, Government of Kerala, Public Sector Enterprises and Autonomous institutions.
3.22 CMD also prepared the “Review of Public Enterprises in Kerala”, which forms part of the budget documents of the state, on behalf of the Bureau of Public Enterprises, Government of Kerala, for the twenty-fourth consecutive year. In the training front, CMD, in collaboration with the Bureau of Public Enterprises, Government of Kerala conducted Management Development programmes for Officers/Managers of the Public enterprises in Kerala during the year 2011-12. Ten programmes were conducted during the year covering 202 managers of various State level Public enterprise.
Central Sector Investment
3.23 Central Sector Investment in Kerala is र 28455.29 crore (2.3%) during 2010-11 against the All India figure of र 1263664.85 crore*. State-wise analysis shows that other southern states have higher investment in Central PSEs. Andhra Pradesh ranked 2nd ,Tamilnadu 3rd and Karnataka 10th. As for Kerala it ranked 16th. Though the Central Sector Investment to Kerala has been increasing in absolute terms , the percentage share has decreased from 2.4 percent in 2007-08 to 2.3 percent in 2010-11 . Details of Central Sector Investment in Kerala from 2008 to 2011 are given in Appendix 3.11 and Central Sector Investment in selected states are given in Appendix 3. 12.
Micro Small and Medium Enterprises (MSMEs)
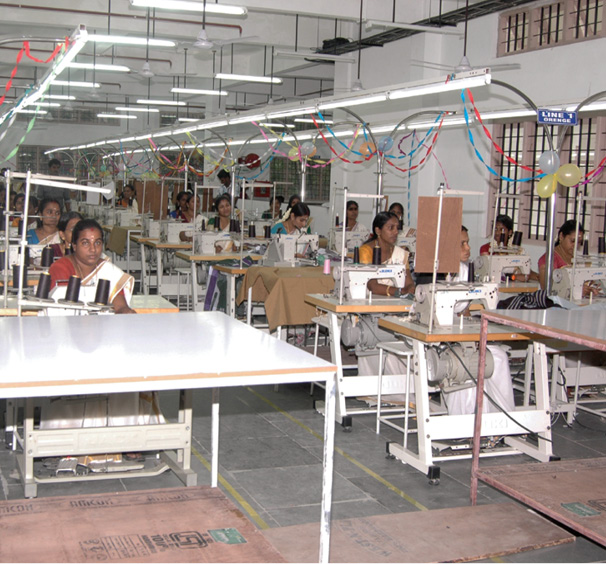
3.24 The Micro, Small and Medium Enterprises (MSME) sector has emerged as a highly vibrant and dynamic sector of the Indian economy over the last few decades. It is estimated that this sector contributes about 45 per cent of manufacturing output and 40 per cent of total exports of the country and employs about 69 million persons in over 29 million units throughout the country. Within the MSME Sector there is a significant increase of Micro Enterprises, both in terms of working enterprises and employment. There are over 6000 products ranging from traditional to high-tech items manufactured by the MSMEs. Kerala is one of the main centres of MSMEs in the country. In fact as per the 4th MSME Census**, Kerala accounted for nearly 10 percent of the total working MSMEs in the country and provided an employment for nearly 7 per cent of the total employed in MSME sector in the country. Though highly ranked in terms of number of units, employment provided, fixed assets and investment in P&M, Kerala did not figure in the top 10 states in terms of output produced.
3.25 In Kerala, MSME sector, which has been provided special support by the Government, contributes significantly towards domestic and export markets, employment, income generation and foreign exchange earnings by producing varieties of products ranging from traditional to modern. MSMEs play a critical role in innovation and have ability to experiment with new technologies. However, they often suffer from lack of funds, poor access to technology and markets and face the difficulty of attracting skilled manpower. The industries coming under this sector are Handicrafts, Handloom, Khadi, Food processing industries, Garment making and Textile industries, industries related to coir/wood/bamboo/Plastic/rubber/ leather/ clay products etc.
Box 3.3
MSME sector in Eleventh Five Year Plan (2007-12)
Achievements
In the plan period, State as well as Central Government provided assistance such as working capital, skill development training, assistance for participation in fairs, marketing, creation of adequate infrastructure, technology upgradation and facilitating appropriate investment climate to attract private investment to MSME sector for improving the volume, quality, energy consumption, environmental effects on production in the sector and for diversification of value added products.
Major Issues of the sector
• Lack of Infrastructure facilities, Land Acquisition delays and Environmental Issues
• Delay in getting license and clearance.
• Limited credit flow to MSME
• Lack of skilled man power
• Lack of proper Entrepreneurship Development Programmes/Skill Development Programmes.
• Inadequate collaboration between technology providers and entrepreneurs
• Lack of modernization and new designs/ innovations
• Inadequate marketing facilities for value added products
Profile of the MSME Sector
3.26 The total number of SSIs/MSMEs registered in Kerala as on 31.3.2012 is 205987 against 194908 in the previous year indicating a growth of about 6 percent. Of this, 4 percent are promoted by SCs, approximately 1 percent by STs and 25 percent by women entrepreneurs. The total investment was र 1083169 lakh in 2011-12 against र 892526.17 lakh in the previous year, with an increase of more than 26 per cent and the total number of employment generated was 1021162 indicating about 8 per cent over the previous year which was 947981.
3.27 Investment, production & employment in MSME sector over the last 5 years is shown in the Fig 3.2. The investment & production has been increased significantly over the period while employment remains almost unchanged. The data is given in Appendix 3.13.
Fig 3.2
Investment, Production & Employment in MSME sector in XIth Plan
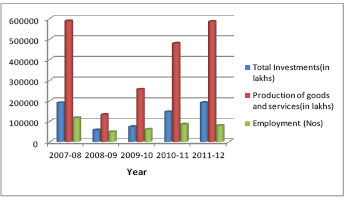
3.28 The number of new enterprises that filed Memorandum during 2011-12 in the MSME sector, was 11079 making a percentage increase of 2 percent from the previous year, while the investment increased by 31 percent to र190642.75 lakh. The employment generated is 79181, which shows a narrow decrease while the value of goods and services produced has been increased by 22 per cent ie, र 584985.35 lakh. Out of the new enterprises that filed memorandum, 341 are constituted by SCs, 84 by STs, and 2606 by women entrepreneurs.
3.29 Details of enterprises that filed memorandum & District-wise details of enterprises which filed memorandum in Kerala during 2011-12 and 2012-13 (up to 30.11.2012) are given in Appendix 3.14, 3.15, 3.16. and in Fig 3.3.
3.30 During the current year (as on 30.11.2012) 7881 new enterprises have filed memorandum with an investment of र 124392.15 lakh to provide employment to 53005 persons.
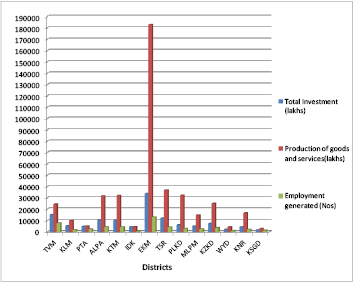
3.31 District wise analysis reveals that during the year under review, Ernakulam occupies highest position in all aspects and Idukki was at the lowest position except in the value of goods and services produced.
Fig 3.3
District wise Investment, Value and Employment of Enterprises registered in Kerala as on 30.11.2012
Industrial Co-operative Societies
3.32 In Kerala, the total number of Industrial Co-operative Societies registered as on 31.03.2012 is 2466 against 2275 in the previous year which made an increase of 8 per cent. Out of which, 811 Societies were registered by women. The total number of working Industrial co-operative societies as on 31.3.2012 is 582. The details are given in Appendix 3.17.
Industrial Development Plot / Areas
3.33 Directorate of Industries and Commerce (DIC) has also promoted Investment by providing and developing infrastructure facilities for small scale sector in the state. At present there are 37 DA/DP s
under DIC having a total acquired area of 2481.37 acre and out of which 40 acres of land given to KINFRA and 20.75 acres of land transferred to various agencies. Out of the total area, 2094.76 acre is
allotted to 2616 industrial units and of which 2019 are working. The details are given in Appendix 3.18.
Mini Industrial Estates
3.34 The total number of Mini Industrial estates under DIC as on 31.03.2012 was 94 and the total number of SSI units were 780. Out of which 663 units were working. The total number of employees under the units were 3345. The Income generated from these units amounted to र 11952.86 lakh during 2011-12. The details are given in Appendix 3.19.
Industrial Cluster Development
3.35 Industrial clusters are increasingly recognised as an effective means of industrial development and promotion of small and medium-sized enterprises. For MSME participants, clusters play an important role in their inclusiveness, technology absorption, efficiency improvement and availability of common resources. The Ministry of Micro, Small and Medium Enterprises (MSMEs) adopted the cluster approach as a key strategy for enhancing the productivity and competitiveness as well as capacity building of small enterprises.
3.36 The major clusters in Kerala are Rubber cluster, Rice Millers cluster, Furniture cluster, Plastic cluster, Plywood cluster, Terra Tile cluster, Wood cluster, Ethnic food processing cluster, General engineering cluster, Printers cluster, Natural Fibre & allied products cluster, Automobile cluster, and Note books cluster.
3.37 The Kerala Bureau of Industrial Promotion (K-BIP) is coordinating the Cluster Development activities throughout the State in association with Directorate of Industries and Commerce and the respective District Industries Centres. It coordinates the implementation of setting up of Common Facility Centers (CFCs) in clusters as per MSME EDP scheme of Government of India. Under MSME EDP scheme of Government of India in the year 2011-12, two projects for setting up of Common Facility Centers (CFC) in Wood cluster, Kollam and Wood Furniture Cluster, Taliparamba, Kannur were sanctioned.Government of India has sanctioned assistance of र 259.53 lakh for setting up CFC in Wood cluster at Kollam, of which Government of Kerala share is र 51.91 lakh ie.20 per cent.
MSME Development Institute, Thrissur & Cluster Development in Kerala
3.38 MSME-Development Institute, Thrissur, Kerala (MSME-DI, Thrissur), is the field outfit of Development Commissioner(MSME) under the Ministry of MSME, Government of India to take care of the needs of MSME sector in the State of Kerala and the Union Territory of Lakshadweep, in the area of Techno-economic and managerial consultancy services.
3.39 The Institute has conducted 148 tailor made development training programme on Entrepreneurship Development, motivation campaigns, Business Skill Development, Entrepreneurship Skill Development, Management Development and Special Skill Development and several Educational Seminars and other awareness programmes during 2011-12. 6393 persons benefited through these programmes of which almost 24 percent belongs to SC/ST. The institute has been providing technical consultancy to the units for acquiring ISO 9000/14000 scheme and also providing reimbursement to the extent of 75 per cent of the expenses incurred by the units under the scheme.
3.40 MSME-DI, Thrissur has taken up 6 clusters for development. They are in the areas of Gold Ornaments, Dies & moulds, Notebooks, Rice Milling, General Engineering and Diamond; and the work thereof is in progress. Details are given in Appendix 3.20.
Box 3.4
Major schemes of the Annual Plan 2012-13
Entrepreneurship Support Scheme(ESS)
Provide assistance to enterprenuers in Fixed Capital Investment and Technology Acquisition to start new enterprises with special attention to women and SC/STpopulation,Priority industries and enterprises are being started in Wayanad and Idukki Districts.
Infrastructure Development under MSME sector – Multi storied Industrial estates.
Development of industrial estates for the benefit of MSME entrepreneurs, with quality infrastructure like roads, power, water, waste management etc. through PPP mode. It is envisaged to construct 2 Multistoried Industrial Estates at Kochuveli & Manjeri and an exhibition cum convention centre Kottakkal in the year 2012-13.
Capacity Building
Other than giving emphasis on skill development, the scheme provides Industrialization support/ other industrial promotion activities and creation of Business Incubation services.
Development of Commerce
Assistance to conduct research studies and evolve long term policy frame work for the sustained growth of commerce, development of infrastructure, conduct or participate in national and international events/exhibitions and to motivate MSME sector through awards .
Small Industry Cluster Development Programme
This is a Centrally Sponsored Scheme of cluster development for micro, small and medium enterprises which provides assistance for sourcing of raw material,offers mutual credit guarantee for sourcing loans and assists on common brand creation, marketing, setting up of Common Facility Service Centre, training and quality testing.
Prime Minister’s Employment Generation Programme (PMEGP)
3.41 Government of India have introduced PMEGP Scheme, ie, credit linked subsidy programme from 2008-09 by merging the two schemes viz,PMRY and REGP.The Khadi and Village Industries Commission (KVIC) is the nodal agency for implementation of the scheme at national level. In Kerala, State KVIC Directorate, State Khadi and Village Industries Board(KVIB) District Industries Centres (DICs) and bankers are the agencies for implementation of the scheme. A target of 728 number of units was allocated to District Industries Centers. and 1112 applications received during the year 2011-12. The banks sanctioned 851 applications which includes pending applications in the banks during the previous year and provided Margin Money of र 1162.13 lakh. Details are given in Appendix 3.21 and 3.22.
Bank Credit to SSI / MSME Sector
3.42 The outstanding bank credit to various sectors by the commercial banks in Kerala at the end of March 2012 was increased by 22 percent ie. र 149293 crore against र 121982 crore in the previous year. The outstanding flow of credit to MSME sector was र 20593 Crore which also shows an increase of 22 percent from र 16894 crore in 2011-12. As on 30.06.2012 in the current year the outstanding advances to MSME sector is र 19942 Crore. The status of flow of credit to various sectors is given in Appendix 3.23.
Small Industries Development Bank of India (SIDBI)
3.43 Small Industries Development Bank of India (SIDBI) is the principal financial institution for the promotion, financing and development of MSME industries. It also acts as the nodal agency for the scheme sponsored by Government of India in this regard.
Kerala Small Industries Development Corporation (SIDCO)
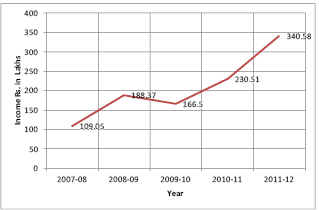
3.44 Kerala Small Industries Development Corporation was established for strengthening the Small Scale Sectors in the State. It provides infrastructure facilities such as land, work shed, water, distribution of scarce raw materials, marketing the products etc. by setting up of industrial estates, mini industrial estates and industrial parks. Execution of construction works for Industries department and public sector undertakings are the other activities of SIDCO. There are 17 major industrial estates and 802 units are working in these estates. These working units provided nearly 7188 employment opportunities as on 31.03.2012 which is 13 percent more than that of the previous year. Besides, there are 36 mini industrial estates under SIDCO as on 31.03.12.About 1750 employees are working in 328 units all over the states. The employment provided and income generated through SIDCO units has been increased in last 5 years and the turnover during 2011-12 was र 204.00 Crore while it was र 127.00 crore in the previous year. Details of SIDCO are given in Appendices 3.24, 3.25, 3.26 and 3.27.
Fig 3.4
Income generated through SIDCO units in XIth Plan
Food Processing Industries (FPI)
3.45 Food processing industry is a sunrise sector that has gained prominence over the recent years. As per Annual Survey on Industry results, in India, the contribution of food processing sector to GDP has been growing faster than that of the agriculture sector. It has been recognized as a priority sector in Kerala due to its potential for sustainable and more inclusive growth, diversification, possibility of generating substantial employment and further advancement in respect of industrial development in urban and rural areas. FPI in Kerala are seen in both organized as well as unorganized sectors. The spices, pickles and the marine products are the major food product export from Kerala. Two thirds of Kerala’s export income comes from processed food. Dairy products, Fish/Meat products, Rice & wheat products, Ready to eat/ Ready to cook products and bakery products, masala powder, Coconut & other oils, Ayurvedic medicines, Fruit juices etc are the major food items produced in the State.
3.46 Ministry of Food Processing Industries is the nodal Ministry of the Government of India for Food Processing Sector in India. A State Food Processing Mission has been recently set up for which Central Assistance will be available to set up cold chains, technology development, Research & Development etc.
3.47 Kerala Industrial Infrastructure Development Corporation (KINFRA) is the state agency engaged in the promotion of food processing industry in the State. KINFRA has set up exclusive Food Processing Parks to suit the specific needs of the food processing sector and they offer space for food processing units in their 12 Industrial parks, as the demand for space is high. Out of these Mazhuvannur (Ernakulam) and Kakkancherry (Malappuram) food processing parks are having the highest number of units. KINFRA provides 4114 sq.ft space for 132 food Processing Units with an investment of र 26979 lakh. Details are given in Appendix 3.28.
3.48 The National Centre for Hazard Analysis Critical Control Point (HACCP) Certification in association with K-BIP has initiated the process of auditing and certification of 39 food processing and allied units from the State and outside the State. Out of this, NCHC has successfully audited and certified 24 food processing units and the remaining is under progress.
Promotional Events and Exhibitions
3.49 The Directorate of Industries and Commerce conducted/participated in 20 Exhibitions /Fairs /Expos inside Kerala with 740 stalls in 2011-12 and generated an income of र 53.68 lakh. The DIC represented Kerala in 5 national/international Exhibitions/ Fairs/ Expos outside Kerala with 64 stalls. Details are given in Appendix 3.29.
Grand Kerala Shopping Festival (GKSF)
3.50 GKSF aims to make the State of Kerala a prominent International Shopping destination by making use of the brand image of Kerala Tourism and upgrade the infrastructure of the traditional marketing centers in the State. The Government organized the fifth edition of the event through Department of Tourism in association with Department of Industries and Commerce and other departments during the period from 1st December 2011 to 15th January 2012.
3.51 Department of Industries and Commerce along with K-BIP also organized other promotional events and assisted in the participation of Kerala State in various national and international events, for industrial promotion and to showcase investment friendly climate of the State.
Participation in National & International events
• Aahar 2012, New Delhi - Gold Medal for Kerala Pavilion
3.52 A Kerala Pavilion set up by Department of Industries and Commerce, Govt. of Kerala won the Gold Medal for the excellence in display at “Aahar 2012” the 27th International Exhibition on Food, Food Processing, Hotel & Restaurant equipments & Supplies, which was organized by Indian Trade Promotion Organisation (ITPO) with the support of Ministry of Food processing Industries, GOI at Pragathi Maidan, New Delhi from March 12 to 16, 2012.
• ProFoods ProPack 2011
3.53 The 10th edition of the International Processed Food & Packaging Exhibition “ProFoods ProPack 2011” was organized by the Sri Lanka Food Processors Association (SLFPA) and Government of Sri Lanka at Sirimavo Bandaranike Memorial Exhibition Centre, Colombo from Aug 26 to 28, 2011.
• Annapoorna World of Food India, 2011, Mumbai
3.54 The 6th edition of “Annapoorna World of Food India 2011”, the exhibition of Food Processing & Related Equipments, Hotel and Restaurant Equipments & Supplies was organized by the Federation of Indian Chamber of Commerce & Industry (FICCI) and Kolenmesse GmbH ( organizer of Anuga Food Fair, Germany) from November 16 to 18, 2011 at Mumbai.
• Participation in Dubai Shopping Festival 2012
3.55 Kerala State was the ‘Partner State’ of the India Pavilion at Global Village in Dubai Shopping Festival held from January 5, 2011 to February 27,2012.
• Malappuram Crafts Mela 2011
3.56 The fifth edition of the spectacular traditional fair, Malappuram Crafts Mela was organized as part of the GKSF from December 16 to 30, 2011 at Kottakkunnu Maidan. Turkey was the Partner Country for the Mela and 10 artisans/craftsmen from Turkey demonstrated their products and skills in the Crafts Mela.
• Kerala Bamboo Fest 2011
3.57 The 8th edition of ‘Kerala Bamboo Fest’ was organized at Jawaharlal Nehru Stadium Ground, Kaloor, Kochi from December 8 to 11, 2011.
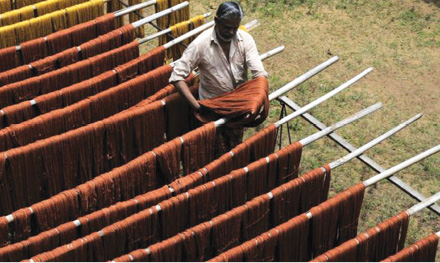
Handloom Sector
3.58 The Handloom Sector in Kerala stands second to the coir sector in providing employment among the traditional industries of the State. It provides employment to about 50000 of which 40 percent are women. The Handloom Industry in the State is mainly concentrated in Thiruvananthapuram and Kannur District and in some parts of Kozhikode, Palakkad, Thrissur, Ernakulam, Kollam and Kasaragod Districts. The Industry is dominated by the Co-operative sector covering with 94 percent of total looms. The remaining six per cent of Handlooms units are owned by Industrial entrepreneurs. The Co-operative sector consists of factory type and cottage type societies. There were 591 registered Primary Handloom Weavers Co-operative Societies in the State as on March, 2012, indicating almost a 8 per cent decrease from the previous year, of which 166 are factory type and 425 are Cottage type societies. All of these are in working condition as at the end of financial year 2011-12. Details are given in Appendix 3.30.
3.59 The major varieties of products produced in the handloom sector of the State are dhothis, furnishing material, bed sheets, grey saree and lungi. The production of these items contribute 67 per cent of the total production of handlooms. About 80 percent of the major items are produced in the southern region followed by the North (12 per cent). Of the total production, nearly 95 per cent is contributed by the co-operative sector.
Box 3.5
Handloom Sector in XIth Plan (2007-12)
Objectives
Repositioning and strengthening of the handloom industry to face up to global challenges was envisaged in the Eleventh Plan by introducing measures like technology upgradation, professional marketing, developing regional brand and encouragement of private sector investment. The development and production of value added, diversified and innovative products have been given priority in this sector for enhancing exports and thereby the income and prosperity of the traditional workers and their families.
During the XIth Plan period, the entire outlay of र 231.21 Crore was utilized. In fact the expenditure was र 235.48 Crore (nearly 102 per cent of outlay). During 2010-11 an amount of र 55.19 crore has been utilised against the outlay of र 56.68 crore. The corresponding figures for 2011-12 are र 65.42 crore and र 57.67 crore.
Achievements
These include the establishment of Indian Institute of Handloom Technology at Kannur, establishment of hank yarn production centres at Kannur, Alappuzha and Thrissur co-operative spinning mills, Registration of the products such as Kuthampully saree, Kasargod saree and Balaramapuram saree and fine fabrics under Geographical Indication Act 1999 and setting up of 20 clusters and 21 Group projects with the support of GOI. Assistance has been given to the propagation of handloom mark scheme. A new project ”Keralathanimakku kaithari” was introduced. New technology developed with the help of IIHT, Salem for pre-loom process and new designed products have been introduced.
Handloom Industry provided employment to almost 1 lakh weavers.
Major Issues of the sector
• Low productivity due to lack of technology intervention & poor market segmentation
• Competition from cheap power loom fabrics and dumping of cheap fabric from outside the
State.
• Lack of dissemination of the quality and innovative designs.
• Lack of product diversification in accordance with new trends.
• Difficulty in getting workers due to low wages.
• Lack of working capital.
• Fluctuation in hank yarn price.
• Weak performance of apex societies and organizations.
Major Schemes of XIth Plan to promote Textile sector
• Integrated Handloom Development Scheme through Cluster and Group Approach
• Integrated Handloom Cluster Development Scheme (IHCD) to facilitate sustainable
development to handloom weavers located in identified clusters into a cohesive, self
managing and competitive socio-economic unit.
• Revitalisation and strengthening of handloom co-operatives, apex societies and
handloom development corporation
• Upgradation to Powerloom/ modernisation of factory type societies
• Establishment of mini pre-loom process centres through grants and loans
• Contributory Thrift fund for welfare of weavers
• Partial Mechanisation of Preloom Processing with 100 percent grant
• Upgradation of Facilities for Training in Powerloom
• Insurance Schemes for workers - Health Insurance Scheme with Central Government
Assistance targeted for 15000 weavers.
3.60 Government Assistance extended for the development of handloom industry, by way of loan is र 11576.27 lakh and grant is र 8330.14 lakh for the last five years. Details are shown in Appendix 3.31.
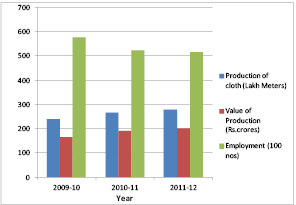
3.61 The total production of handloom cloth shows an increase of about 5 percent from 26.68 Million metres in 2010-11 to 27.89 Million metres in 2011-12. But the total value of production shows an increase of about 6 percent from र 190.96 crore to र 202.14 crore during the period. The total number of weavers employed increased from 52386 in 2010-11 to 51590 in 2011-12. The number of women employed is also increased from 20909 during 2010-11 to 21632 in 2011-12. The total employment decreased from 96.65 lakh man days in 2010-11 to 90.32 lakh man days in 2011-12. Details are given in Appendix 3.32 and in Fig 3.5.
Fig 3.5
Production and Employment in Handloom sector
Institutional Support to Handloom sector
3.62 Promotional measures of handloom sector such as procurement, sales and marketing of handloom fabrics are being undertaken by two state level organisations namely Hantex and Hanveev.
3.63 Hantex is the apex society of handloom co-operative societies in the state. Number of PHWCS registered under Hantex is 469. Despite grants and loans are being given to the society, the organisation is running in loss as per the balance sheet of the year 2011-12. The working results of Hantex are given in Appendix 3.33.
3.64 Hanveev is a PSU setup to assist handloom weavers outside the co-operative fold by providing necessary raw materials at reasonable price and making arrangements for marketing their products. This organisation is also running in losses and the net loss at the end of 2011-12 is र 976.68 lakh while it was र 479.86 lakh at the end of 2010-11. The working results of Hanveev are given in Appendices 3.34 & 3.35. Hanveev conducted 23 Exhibitions within the State during 2011-12 and generated an income of र 121.99 lakh.
Textile Sector – Spinning Mills
3.65 The Textile Industry in Kerala is spread over in public sector as well as in Co-operative Sector and there exist 14 Spinning Mills jointly in the public/ co-operative sector. In addition, 4 new spinning mills are functioning at their initial stage.
3.66 Kerala State Co-operative Textile Federation (TEXFED) has nine Co-operative Spinning Mills. Five of them are administered by the Government and four have elected boards. Spinning Industry in Kerala is facing deep crisis and the Mills in Co-operative Sector have huge accumulated losses amounting to र 132.52 crore. An amount of about र 43 crore has already been provided to these mills in the XIth Plan Period, including under the NCDC approved revival packages of Malappuram and Cannanore Co-operative Spinning Mills. The 4 spinning mills under Kerala State Textile Corporation (KSTC) shows declining trend in production continuously, even though an amount of about र 11 crore has been provided for the modernisation of the mills in the year 2011-12. This includesर 3 crore provided for Sitaram Spinning Mill, which is under the administrative control of KSTC.
3.67 The Co-operative Spinning Mills in the State were formed with a social objective to provide raw material support to the traditional handloom weavers of the state. But from 1999 onwards due to various reasons this has been stopped. An integrated approach for the industry has been put in place with three hank yarn production centres established at Cannanore, Alleppey and Trichur Co-operative Spinning Mills by the Government to provide raw material support to the weavers.
3.68 The main handicaps faced by the Mills were the lack of working capital and non availability of raw materials. Due to the Government support of र 7 crore to procure cotton for the entire textile sector through professionally constituted committee comprising of RIAB, TEXFED and KSTC, raw material cost was brought down significantly. Spinning mills in the State were set up several years ago and require modernization.
Power loom
3.69 In the power loom sector there are 17 working co-operative societies. Out of the 536 powerlooms in the state 93 per cent is in the co-operative sector and the rest in the private sector. Total production of cloth in this sector remains almost unchanged over the last 5 years and it is 27.82 lakh meters during 2011-12 with slight increase over the previous year . Details are given in Appendix 3.36.
3.70 The five integrated power loom co-operative societies in the state at Calicut, Wayanad, Neyyattinkara, Kottayam and Malappuram have been accelerated by providing budgetary support.
3.71 The Calicut Integrated Power loom Co-operative Society Ltd., has been converted as a textile park comprising all the segments of a composite mill, with semi automatic and automatic powerlooms together. A modern processing unit to process yarn for both handloom and power loom with modern facilities and a garment making unit with state of art technology and professionally trained manpower is also functioning in this project.
3.72 In Wayanad, the remotest district in Kerala, a rehabilitation cum industrial project is functioning. As part of it, a powerloom production centre has been started in Thirunelli for tribal women folk for providing training. This will be converted as an employment generating centre in Powerloom & Handloom for adivasi women. Integrated Power loom Co-operative Societies in Neyyattinkara and Kottayam has also been activated and are in the process of production of grey cloth and some conversion orders for export market. The sizing unit functioning at Kottayam is activated as a common facility centre for all the integrated power loom Co-operative societies in the state.
Handicrafts
3.73 Handicraft industry is one of the traditional industries of Kerala, providing employment to Artisans. Eighty percent of these artisans are from socially and economically backward classes. Kerala has the tradition of making beautiful handicrafts with ivory, bamboo, palm leaves, seashells, wood, coconut shells, clay, cloth, coir, metals, stone, lacquer ware etc. and the artists are experts in making beautiful flower vases, ash trays, ornamental plates, jewel boxes, miniature boats, elephants, idols, kathakali masks and embroidery works. Many antique handicraft treasures can be seen in palaces, old heritage homes and museums in the State.
3.74 Kerala State Handicrafts Apex Co-operative Society (SURABHI), Handicrafts Development Corporation and Artisans Development Corporation are the major promotional agencies in the handicraft industry. SURABHI is the apex organization of primary handicrafts co-operatives established with a view to uplift the artisans by marketing the product produced by the primary co-operatives and implementing welfare schemes with the assistance from State and Central Governments.
3.75 Handicrafts Development Corporation of Kerala is engaged in procuring and marketing handicraft products by giving fair returns to artisans through SMSE Institute and Kairali emporia spread all over India. At present it is having a net work of 19 such sales emporia. HDCK also owns a Common Facility Service Centre (CFSC) at Thiruvananthapuram where lot of artisans are provided with the facilities for the development of crafts. The Kerala Artisans Development Corporation (KADCO) is one of the State agencies to provide assistance to artisans for establishing production units, promoting marketing of products and providing employment opportunities through schemes of trade fairs and marketing centres.
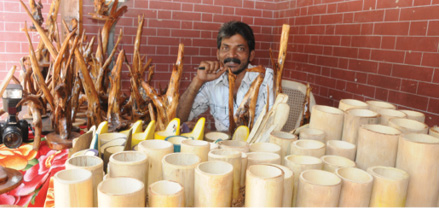
Bamboo Industry
3.76 Bamboo/Reeds industry is one of the age-old traditional industries of the state. The Kerala State Bamboo Corporation Ltd. was established in 1971 in Kerala with main objectives to develop & promote industries based on bamboo, reed, cane and rattan. It is an ISO 9001-2000 certified Company now. Kerala State Bamboo Corporation’s main activity is collection of good quality reeds from Government forests and distributing these reeds to the registered mat weavers of the Corporation, throughout the State of Kerala, on credit basis and procuring woven mats made of these reeds at reasonable prices, thus providing employment and regular means of livelihood to these weaver sections of the society. Bamboo mats, Bamboo ply, Flattened board, Flooring tiles are the main products. The Hi Tech Bamboo Flooring Tile Factory was commissioned in February 2011 at Nallalam, Kozhikode with a view to manufacture Hi-Tech Bamboo Flooring Tiles using Bamboo as the main raw material using imported Chinese Technology. There are four Feeder/Primary Processing Units at Palakkad, Kadampuzha, Mananthawady and Nadapuram.
3.77 During XIth Plan project based assistance has been provided to the Apex Organizations in the handicraft sector. Major schemes under handicrafts sector are given below.
• Share Capital Contribution to Handicrafts Primary Co-operative Societies
• Assistance to Apex Organizations in the Handicrafts Sector
• Entrepreneur Assistance Scheme in Handicrafts/ Artisan Sector
• Establishment of Common Facility Service Centres for Handicrafts
Box 3.6
Lacquer Ware
The combination of woodcraft and metal produces lacquer ware. Wood carvings are famous and many skilled workers have showed their talents in such artistic works on wood. The trees mainly used for carvings are sandal wood and rose wood. Various shapes are carved in these woods after which a lacquer finish is given to them. The final product is then decorated with various precious metals. The district in Kerala which is popular in these works is Ernakulam.
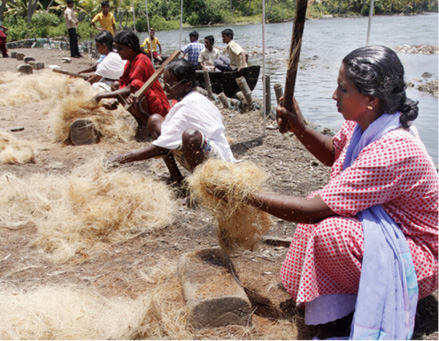
Coir Industry
3.78 Coir Industry is the largest agro based Traditional & Cottage industry in Kerala and is concentrated mainly in the rural areas. It provides livelihood to nearly 3.75 lakh people, of which women constitute 80 per cent. Government has given more emphasis on Coir Industry by considering the special features and problems being faced by it. India’s export of coir accounts for a value of र1052.63 crores during 2011-12 and Kerala’s share is 80 per cent.
3.79 Coirfed, Kerala State Coir Corporation(KSCC), Foam Matting’s India Ltd(FOMIL), National Coir Research & Management Institute(NCRMI), Exporters, Coir Co-operatives, Coir yarn producers, product manufactures and workers are the major stake holders of the Coir industry. The welfare activities are implemented through the Kerala State Coir Workers Welfare Fund Board. The Co-operative Sector as well as Private Players dominates the Coir Industry in Kerala.
3.80 Fomil has a state of the art manufacturing facility such as Latex baking Plant, Modern Dye House, Fully Automatic Power Loom etc. and its spare capacity is used for undertaking job works of other exporters too. Fomil has no liability against loans. KSCC’s Sales turnover increased from र 2.94 crores to र 56.38 crores between 2006-07 and 2011-12. The company is working at profit in the last three years and र 211.00 lakhs is the profit during 2011-12. Coirfed has two factories engaged in the manufacture of value added products and has 4 defibering units. The sales turnover of Coirfed during 2011-12 (tentative) is र 3200 lakhs.
3.81 The export of coir and coir products from India during the year 2011-12 was 410854 MT valued at र1052.63 crore as against the export of 187567 MT valued at 592.08 crore in 2007-08. This recorded an increase of 119 per cent in quantity and an increase of 78 per cent in terms of value over the export achieved during 2007-08. Among the items of export from India, curled coir, coir fibre, coir pith, coir rope, coir yarn, coir other sorts coir geo-textile, handloom mattings, Power loom Mats & rubberized coir have shown an increase both in terms of quantity and value when compared to the previous year. The items such as coir rugs & carpets have shown a decrease both in terms of quantity and value over to the previous year. The items handloom mats & tufted mat have shown an increase in value even though the quantity has decreased. Item wise export of coir and coir products from India during the XIth Five Year Plan are shown in Appendix 3.37. Government has been providing adequate financial support to the development of the sector. Coir Kerala-2012 – ‘an International event on Coir and Natural Fiber Products’ aimed at exploring and expanding the international market was conducted at Alappuzha, in which buyers from 32 countries participated.
3.82 Under Regulated Mechanization of Coir Industry scheme, during 2011-12 as many as 97.77 lakh number of husk procured by spending an amount of र 136.92 lakh, purchased 18348.12 tonnes of fibre at a cost of र 5701.97 lakh and produced 15408.2 tonnes of yarn worth Rs.3286.39 lakh, through coir co-operative societies. Details of the last Five Years are shown in Appendix 3.38. During 2012-13, the State Govt. has provided financial outlay to the tune of र 100.7crore under plan of which र 44.55 crore has been expended as on 31st January2013. This sector, achieved 100 per cent financial targets in 2011 and 2012.
3.83 Since the sector is society dominated, uneconomic societies are liquidated and the number of working societies decreased from 499 (as on 31.3.11) to 473(as on 31.03.12). The reduction in the number of societies was effected as a part of modernization and revival program initiated in the department, which means the subsector, is in the path of development. Details of the societies are shown in Appendix 3.39.
Box 3.7
Major Schemes in the Coir sector (2012-13)
1. Regulated Mechanization of Coir Industry – The Scheme is intended to modernize the industry and enhance the productivity and the amount sanctioned in the current financial year is र 5600 lakh.
2. Marketing, Publicity, Propaganda Trade Exhibitions and Assistance for Setting up of Showrooms – An amount of र 300 lakh is set apart for the scheme and under this scheme Coir Kerala-2013 – ‘an International event on Coir and Natural Fiber Products’ was conducted at Alappuzha.
3. Price Fluctuation Fund- The scheme is intended to stabilize the price of coir fibre, yarn, and coir products. र 2400 lakhs is the current year’s allocation.
4. Coir Geo- Textiles Development Programme- The Programme is aimed at implementing pilot projects, inclusion of Geo-Textiles as a standard engineering material, creation of awareness on Geo-Textiles, strengthening of R&D and marketing efforts, orientation on Geo-Textiles. Current year’s outlay is र 30 lakh.
5. Cluster Development programme in Coir Sector – र 300 lakh is the current year’s allocation and at present 5 clusters are functioning under coir sector and more are being developed.
The National Coir Research & Management Institute (NCRMI)
3.84 The National Coir Research & Management Institute (NCRMI), the State Government Organization is looking after the Research and Development of Coir Sector, and is acting as a nodal agency for coordinating the technological, commercial and academic developments in the entire gamut of activities related to the coir sector in Kerala. The National Coir Research & Management Institute has developed a defibering machine capable of defibering 3000-4000 husk/day and around 185 machines were supplied on demand. During 2011-12, an amount of र 200 lakh was provided to the Centre for undertaking various R&D works and 100 per cent achievement attained.
3.85 Under the Prime Minister’s Gram Sadak Yojana (Bharat Nirman), it has already been decided to use Coir Geo-Textiles for construction of rural roads in nine States and this is likely to be extended in 28 states. This is a huge opportunity for Kerala Coir Industry.
3.86 The coir industry is likely to face problems in catering to the huge requirements in the rural road sector. Hence it may be required to infuse appropriate technology to improve quality and up-scaling manufacturing capacity in the Twelfth Plan to meet the requirements.
Khadi and Village Industries
3.87 Khadi and Village Industries play a substantial role in generating employment in rural areas with minimum investment. These industries use eco friendly, local resources and generating higher employment opportunities. The Kerala Khadi and Village Industries Board is a statutory body vested with the responsibility of organising, developing and promoting Khadi and Village Industries in the state. Co-operative societies, registered institutions and departmental units carry out the activities of the Board, by availing finance assistance from State Government, Khadi Commission and Nationalised Bank. The Board has achieved 100 per cent financial targets in 2011 and 2012.
3.88 During the XIth Five Year Plan the Departmental Khadi Production Achievement has shown an increasing trend both in the Cloth value & Yarn value. The quantity of cloth and Yarn production has shown an increasing trend up to 2009-10 and then a decreasing trend. The details of Departmental project wise Khadi production for the last Five years are shown in Appendix 3.40.
Box 3.8
Performance of Khadi Sector during 2011 and 2012
• Under Prime Ministers Employment Generation Programme(PMEGP), an amount ofर 905.31 lakh was disbursed as Margin Money Grant to 393 projects. This generated 2884 jobs under Special Employment Generation Programmes, 800 units were set up with a total cost of र 400 lakh and an amount of र 110 lakh was given as a subsidy and 1600 jobs were created (District wise achievement are shown in Appendix 3.41)
• Goods worth र 14472.90 lakh were produced and goods for र 16747.44 lakh were sold by providing employment of 128769 persons. The details of value of production, sales, employment, and wages paid are given in Appendix 3.42
• Under the Expansion & Modernisation of Sliver project at Ettukudukka in Kannur, 797 numbers of cotton bales were purchased.
• The Board conducted Onam Melas to propragate Khadhi
• Goods worth र 31.37 crore has been sold through 216 sales outlets of Khadi & Village Industries. District wise details are shown in Appendix 3.43.
3.89 As part of popularizing and re-establishing the pride in wearing Khadi and Handloom products, the State Government has mandated wearing it in schools and offices on Saturdays.
Box 3.9
Major Schemes in the Khadhi Sector 2012-13
Scheme Outlay (र lakh)
1.Expansion & Modernisation of Sliver project at Ettukudukka in Kannur District 240
2.Marketing, Strengthening of Weaving Sector including Production Incentive to Spinners and Weavers and Establishment of Silk Production Centres 280
3. Special Employment Generation Programme 200
3.90 The strategy for achieving growth during the 12th Plan is to develop product-wise clusters of Khadi and Village Industries products and to develop their domestic as well as export market. Other strategies include introducing innovations in design and technology, creation of entrepreneurship and growth in manufacturing in rural non-farm sector to prevent migration by enhanced allocation for Prime Ministers Employment Generation Programme. The Khadi Reforms Programme,at National Level has been taken up and it includes introduction of Khadi mark.
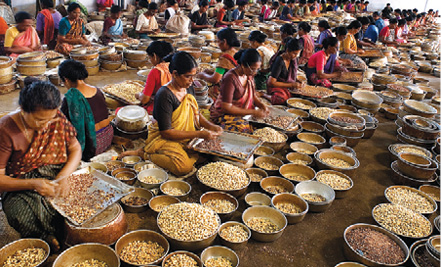
Cashew Industry
3.91 Cashew is an important commercial horticulture crop of India. India is the biggest producer, processor and exporter of Cashew in the world. India’s processing capacity of cashew far exceeds its production of raw nuts, with only half of the cashews processed in the country being produced domestically. Indian cashew industry is dependent on imported raw cashew. One of the key factors in favor of expanding the cashew industry in India is the stable price in the international market when compared to other nuts such as almond, hazel nut etc.
3.92 The Cashew Industry in Kerala is a Traditional Industry mainly concentrated in Kollam District and is mainly controlled by private sector. The industry has a long history of employing large numbers of workers in decentralised units. The industry is highly labour intensive and employs more than 3,00,000 workers. The unique feature of this Industry is that majority of the workers are women from lower economic strata of the society and skills of these workers do not include any entrepreneurial capacities. Many of the workers are barely literate.
Box 3.10
Cashew Sector in Eleventh Five Year Plan (2007-12)
Objectives
Rejuvenation of Cashew industry by Up gradation of facilities, Modernisation of Cashew Factories and Factory sheds, Expansion of domestic market of cashew, Value addition of cashew kernels, International brand building and Export market development were the objectives of the eleventh five year plan. Against the outlay of र 52 crore the expenditure was र 52 during 2010-11. The corresponding figures for 2011-12 are र 52 crore and 46.68 crore.
Achievements
Modernization of Cashew factories. Value added products were produced. Continuous Employment was given to workers of KSCDC & CAPEX with good ESI facilities and other benefits. Branded products were established in domestic and international markets. A wide variety of Cashew Grafts was supplied to farmers and institutions through KSACC.
Major Issues of the sector
1. The rate of growth of production of raw nuts in India and Kerala is very low and the productivity per hectare is also low. Area and production under cashew crop has declined.
2. Cashew factories work at low level of capacity utilization and productivity.
3. Raw nut producing countries started processing kernels and they entered the world market posing a serious threat to Kerala.
4. Global market also witnessed growing demand for substitute nuts and kernels in the place of cashew.
5. The price of kernels which is controlled by market agents in New York undergoes wide fluctuations.
6. The commission system of cashew processing is growing to the advantage of workers as well as State agencies.
Promotion of Cashew Processing in Kerala State
3.93 The Kerala State Cashew Development Corporation (KSCDC) and Kerala State Cashew Workers Apex Co-operative Society (CAPEX) are the two agencies of the State engaged in cashew processing sector in Kerala. These agencies contribute to the upliftment of the workers being most of them are women from lower economic strata of the society.
3.94 CAPEX with headquarters in Kollam, is the apex body of cashew workers primary societies engaged in the procurement of raw cashew nuts and marketing the processed kernels. The Society owns 10 factories. There are about 6300 workers. The society could provide employment for 229 days in 2011-12. The total sales turnover of the CAPEX increased from र 4875.55 lakh in 2010-11 to र 6773.13 lakh in 2011-12, recording a 39 per cent growth. The performance of CAPEX by the last 5 years is given in Appendix 3.44. The KSCDC has 30 factories spread out in the districts of Thiruvananthapuram, Kollam, Alappuzha, Thrissur and Kannur. There are about 18000 workers and majority of them are women. The Corporation process raw cashew nuts into kernels, produce value added products like cashew soup, cashew vita, cashew bitz and cashew powder and market these products. The performance of KSCDC by the last 5 years is given in Appendix 3.45.
3.95 Kerala State Agency for the Expansion of Cashew Cultivation (KSACC) was constituted by Government of Kerala to overcome the crisis of diminishing trend in shortfall of area under cashew cultivation in the State. Since 2008, KSACC has been organizing promotional activities in cashew cultivation and distributing cashew grafts of high yielding varieties and financial assistance to farmers and institutions in the State. KSACC is the nodal agency for the Cashew cultivation activities in Kerala, approved by NHM (National Horticulture Mission) and for implementing NHM project, received a financial support of र 23.70 Crore from Government of India, during the period 2009-10 to 2011-12.
3.96 During the period 2009-10 to 2011-12, the agency could achieve an area of 17299 hectares by promoting cashew cultivation involving more than 100000 farmers and a good number of institutions. Assistance was also given for establishing apple processing units.
Minerals
3.97 Kerala State is endowed with a number of occurrences/ deposits of minerals such as Heavy Mineral Sands (Ilmenite, Rutile, Zircon, Monazite, Silimanite), Gold, Iron Ore, Bauxite, Graphite, China Clay, Fire Clay, Tile and Brick Clay, Silica Sand, Lignite, Limestone, Limeshell, Dimenstion Stone(Granite), Gemstones, Magnesite, Steatite etc. However, mining activities on large scale are confined mainly to a few minerals – Heavy Mineral Sands, China Clay and to a lesser extent Limestone/Limeshell, Silica Sand and Granite. In fact, Heavy Mineral sand and China Clay contribute more than 90 percent of the total value of major mineral production in the State. However, 75 per cent of the mineral revenue comes from the minor minerals.
3.98 Unlike other States, due to the peculiar nature of the State of Kerala (non availability of land for mining, vast expanse of reserve forest and dense population) the mineral resources cannot be exploited with ease. Mining, invites all kinds of environmental problems (lowering of water table, noise pollution, dust pollution, public safety, threat to flora and fauna, contamination of water, deterioration of river ecosystem etc.). However mining in the State cannot be stopped altogether as minerals (especially those of the category of building materials) are an integral part of infrastructure development of the State.
3.99 There are 81 major mineral mines that are in operation in the State. Also there are 3500 licensed minor mineral quarries in the State. Government gets revenue from minerals mainly by way of royalty. Revenue collected during the year 2011-12 is र 44.3 crore ( र 11.17 crore from major minerals and र 33.13 crore from minor minerals) which is 22 percent higher than the previous year collection of र 36.34 crore. Total area covered by mining leases is 2513.84 ha. The mineral wise details of area covered by mining leases are given in Appendix 3.46.
3.100 The production of various major and minor minerals in the state during 2011-12 and the royalty are given in Appendix 3.47. An analysis of revenue collection shows that Palakkad district has the highest collection of र 6.87 crore (16% of total revenue) followed by Kollam (14 per cent). The district wise collection of revenue from major and minor minerals are furnished in Appendix 3.48.
Section 2
Labour and Labour Welfare
3.101 Kerala is a State which ensures decent work, social protection and dignity of labour. The Labour Laws and Labour Welfare Schemes implemented by the State places the labour force of Kerala at a level much higher to that of other States in India. Given the changing dynamics of the employment landscape of the State, the role of the Labour Department needs to be restructured. The Department has to shed its traditional image of an arbitrator between the capital and organised labour and reinvent itself as a pro-active agent of change addressing the new issues facing labour market and its agents.
3.102 The Decent work concept was formulated by the ILO’s constituents – Governments, employers and workers- as a means to identify the Organisations major priorities. It is based on the understanding that work is a source of personal dignity, family stability, peace in the community and encourages democracies that deliver for people and economic growth that expands opportunities for productive jobs and enterprise development. Countries are encouraged to establish social protection floors (*)as a “fundamental element of their national social security systems” and as part of their social, economic and environmental development plans. Those countries that cannot afford the basic social protection measures could seek international cooperation and support to complement their own efforts.
3.103 Low labour participation rate (LPR) and workforce participation rates (WPR) have been persistent characteristics of India’s labour market. In 2008, the LPR in India was only 56% compared to 74% in China and 71% in Brazil. The work force participation in the economy of India and Kerala is in the table No. 3.2
Table 3.2
Workforce Participation in the Economy
Category |
India |
Kerala |
Rural Male |
54.8 |
55.6 |
Rural Female |
28.9 |
22.1 |
Urban Male |
55.4 |
57.7 |
Urban Female |
13.8 |
17.7 |
Source: Estimates based on NSSO 2007-08
3.104 As per the National Sample Survey Report 2009-10, the work participation rates of rural male and female population in Kerala are 55 and 26 percent compared to 56 and 25 percent respectively during 2004-05 and those in urban area for male and female population are 54 and 14 percent compared to 55 and 20 percent respectively in 2004-05 .
3.105 The major hurdle for labour market modernisation in India is the extremely low rate of female labour participation. The numbers of missing women in India-women who withdraw from labour force and engage only in domestic duties-was a staggering 216 million in 2009-10, almost as large as the population of a country like Brazil. The sheer absence of gainful employment opportunities is likely to be the factor most constraining female participation in the workforce. In Kerala, female work participation rate is around 22 percent in rural and 18 percent in urban area during the year 2007-08.
Composition of Workers
3.106 The labour community in Kerala mainly consists of those who are engaged in the informal sector (loading & unloading, casual work, construction work, brick making self employment etc), traditional industries (coir, cashew, handloom, beedi etc), manufacturing sector (small, medium and large industries), IT industry, units in export promotion zones and those who are seasonally employed.
Industrial Relations
3.107 Creating and maintaining good and healthy industrial relations is one of the major functions of the Labour Department. All the activities of this department are focused on ensuring fair working and living conditions of the workers in the State and maintaining cordial relationship between the employer and employee to develop good industrial harmony.
3.108 Kerala is acclaimed nationally and internationally on the achievement of Social Security and Welfare measures. In Kerala, every employee/worker should be a member in any of the Welfare Board and they must be protected by the State throughout their lives. Almost 45 lakh of labour force in the state are protected under any one of the Social Security Schemes. There are 16 Labour Welfare Fund Boards functioning under the Labour Department. The rate of welfare pensions has been enhanced by the Government during the 2011-12.
3.109 Kerala is one of the first states in India, to introduce a welfare scheme for migrant labourers ensuring their pay, welfare, health and the educational aid to their families through Kerala Building and Other Construction Workers Welfare Fund Board with the assistance from the Government. The government is committed to continue the benefits granted to the labourers in crisis ridden plantation sector, like medical aid /education assistance like uniform, note books etc.
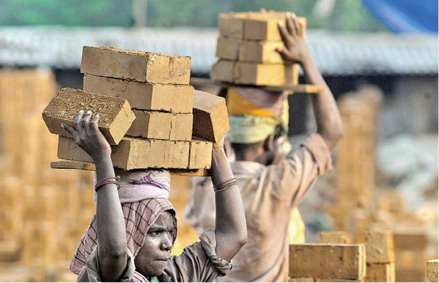
Child Labour
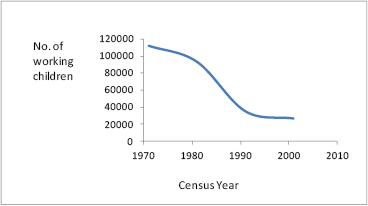
3.110 Eradication of child labour in the state is a matter of policy of the government. The Central Government has enacted rules to this effect. Even before that, Kerala had implemented Rules for eradication of child labour. For this, the Labour Department has implemented two main activities like conducted awareness programmes and persuading the society to not engage in child labour. As part of Child Labour Eradication Day, seminars & awareness camps are conducted in the State. As a result of State’s intervention, the number of working children has been decreased considerably (i.e. 76.6%) from 111801 in 1971 to 26156 in 2001. Decreasing tendency in the distribution of working children in Kerala during the last four censuses are shown in the Fig 3.6
Fig 3.6 .
Number of Working Children in Kerala
Major Activities of Labour Department
3.111 An amount of र 255.95 lakh has been allotted to the Labour Department and the expenditure reported during that period was र161.41 lakh (63 per cent). Three welfare schemes viz, Tree Climbers Disability Pension, Welfare Scheme for the Domestic Workers in Kerala and Maternity Allowances to workers in the unorganised sector are the new schemes of the Department.
Box 3.11
New Schemes of the Department during 2012-13
The Unorganised Workers Social Security Act has come into effect on 31.12.2008 and the State rules were notified on 11.08.2010. The State Board was also constituted.
Rehabilitation programme for Inter State Migrant (ISM) Workers
To ensure Minimum Wages to the employees in different employments, E- Payment of wages introduced in the sectors viz, Textile, Jewellery, IT, Private Bank and Private Educational Institutions.
Plantation Rehabilitation Scheme for welfare of plantation workers.
3.112 The Highlights of Draft Labour Policy 2011 ensures Social protection and Decent working condition and to the labourers. The highlight of Draft Labour Policy of Kerala is in the Box No. 3.12
Box 3.12
Highlights of Draft Labour Policy 2011, Kerala
The Draft Labour policy 2011 proposes to ensure minimum wages to workers in the unorganised sector and check unhealthy tendencies such as ‘nokkukooli’ in the loading and unloading sector. No time frame is fixed for achieving these objectives. All Trade Unions have agreed to the elimination of ‘nokkukooli’ and excessive collection of charges by head load workers. Wherever welfare fund scheme is available, provision will be made for online payment and there will be gradual unification of rates across the State. Disciplinary action will be taken against workers who collect excess charges and those who threaten house owners regarding loading and unloading of household goods. Renewal of registration of workers with the Welfare Fund Board will be made compulsory. Transfer of registration cards and use of ghost cards will be prevented. It will be mandatory for employers to pay wages through banks and the Labour Department will take action on the basis of bank statements if minimum wages are not paid.
The draft policy envisages low cost housing for workers and compulsory registration of migrant workers. Health insurance cover is proposed to be extended to all workers; safety audit will be made compulsory for multi storied buildings. Only registered workers will be allowed to work at building sites.
Fair wages will be introduced in the IT sector also. It is proposed to improve the living conditions of estate workers and to eliminate child labour.
3.113 The Kerala Institute of Labour and Employment is a body for research and development conducting training through workshops/ seminars. In addition, it is conducting memorial lecture series in the names of prominent Trade Union leaders of Kerala. Women development initiatives and special training programmes for unorganised sectors and interstate migrant workers in construction sector are also undertaken.
3.114 An amount of र 320.21 crore has been allotted to the Department for implementing 14 schemes including 4 new Schemes and र 138.14 crore has been expended (43%) as on 30.12.2012 by the Department.
Safety of Workers
3.115 The Department of Factories & Boilers is the statutory Authority to ensure safety, health and welfare of all workers in factories and the general public living in the vicinity of factories through implementing various laws. The department is in the pursuit of prevention of industrial accident and creation of an environment conducive to industrial hygiene as well as prevention of occupational diseases by inspection and advisory services Priority inspection at Major Accident Hazards (MAH) factories, air monitoring studies in hazardous factories, workshop/training programmes for workers and managers, inspection of hazardous factories by specialist inspectors, medical examination of factory workers were the major activities of the department during 2011-12. License Adalat was conducted as part of public interaction and first aid training was also given to public. During 2011-12, an amount of र 200 lakh was provided to the Department and the expenditure reported during that period was nearly र 99 lakh (50 per centp ). The Department has conducted safety training and first aid training for the public. Monthly comprehensive training programmes to industrial workers were also conducted. Through computerisation, online registration, renewal, submission of application, etc could be implemented.
Health Insurance scheme - Rashtriya Swastya Bima Yojana (RSBY)
3.116 RSBY is being implemented in Kerala, from the 1st year of introduction in 2008. As per the Planning Commission estimates, there are 12 lakh BPL families in the State. All of them are being covered under the scheme. The State Government has estimated another 10 Lakh poor families as eligible to be included in the BPL list for this scheme and the entire expenditure for them will be from State Government funds. The scheme will also be extended to the APL families also. The entire premium in this case will be borne by the beneficiary. Accordingly, the State Government has formulated the Comprehensive Health Insurance Scheme (CHIS ) on the same lines of RSBY to benefit these 10 lakh poor families and also the APL families. The scheme was started in 2008 in Alappuzha district and then extended to all the other districts.
3.117 The RSBY and CHIS is jointly implemented by the Labour and Rehabilitation Department, Health and Family Welfare Department and the Local Self Government Department. Labour and Rehabilitation Department is the Nodal Department which administers the scheme. A separate agency, CHIAK (Comprehensive Health Insurance Agency, Kerala ) was formulated for implementation of RSBY & CHIS. All the five Medical Colleges are implementing the scheme. United India Insurance Company, a public sector unit is selected as the insurer. During the second and third years of implementation the State Government had decided to bring in more families into the scheme, they include SC/ST families, fishermen families, ashraya families, agricultural workers, MGNREGS workers who worked for more than 15 days under the scheme, Street Vendors, Domestic Workers, Beedi Workers etc, who are not otherwise included in the BPL list of the Central Govt.
3.118 United India Insurance Company Ltd, Insurer for the previous year, was again chosen as the Insurer for the implementation of RSBY/CHIS for the financial year 2012-13 through a tender process with a premium of र 1100/- per family. Nearly 300 public and private hospitals are implementing the scheme in the State. Claim status of RSBY is available on website of CHIAK (www.chiak.org)
3.119 As per GoI guidelines, 64 KB Cards will have to be issued to all the new families which will be enrolled during January 2013, with validity date starting from 01.04.2013 in the place of existing 32 KB cards. GoI desires to uphold the platform of RSBY with more comprehensive functions so that it can converge more citizen services. Service delivery improvements would be made sustainable and the process would be linked to other welfare initiatives Public Distribution System is the first step and Indira Gandhi Old Age Pension Schemes (IGNOAPS) is the second scheme which will be implemented by using the RSBY platform. 64 KB cards will have more storage facility and has been designed to hold the data of all such welfare measures of Government.
3.120 In Kerala, 35 lakh families have joined the scheme RSBY-CHIS, out of which nearly 25 lakh families come under RSBY and the balance under CHIS. During 2012-13 र 15.00 crore has been provided in the State Budget for the scheme RSBY as 25% state share and र 20.00 crore has been provided for the scheme CHIS. The annual insurance cover is for a maximum amount of र 30,000 for a family of five members including the worker, spouse, children and dependent parents (if included in the BPL family list). The annual insurance premium is fixed through tender process. The State Government provides 25 per cent of the premium and administrative cost. The Central Government provides 75 per cent of the premium (including cost of smart card) directly to the implementing agency, CHIAK (Comprehensive Health Insurance Agency, Kerala).
3.121 The number of patients covered under the RSBY has been increased from 1, 42,700 in 2008-10 to 7, 00,033 (390 per cent) during 2011-12 and the amount spent for that period was also increased from र 44.85 crore to र 211.44 crore (371%) during that period. The scheme has provided surgical and non surgical medical assistance to 7 lakh beneficiaries in the State, amounting र 211.44 Crore during the period under review. The Physical and Financial achievements of RSBY/CHIS is detailed in the Table 3.3
Table 3.3
Physical and Financial Achievement of RSBY/CHIS
Year |
No. of Patients |
Amount र Crore |
||||
| Public | Private | Total | Public | Private | Total | |
2008-2010 |
47858 |
94842 | 142700 | 18.09 | 26.76 | 44.85 |
2010-11 |
143791 |
216437 | 360228 | 51.5 | 61.1 | 112.6 |
2011-12 |
377605 |
322428 | 700033 | 118.79 | 92.65 | 211.44 |
Total |
569254 |
633707 | 1202961 | 188.38 | 180.51 | 368.89 |
Source: Labour Commissionerate
3.122 CHIS PLUS scheme which is implemented through non insurance route has been extended to 41,532 beneficiaries amounting to Rs. 50 crore through the participating Government Hospitals and Government Institutions like RCC, MCC, Pariyaram Co-Operative Medical college, Kannur and SCTIMST up to 30.10.2012.
Aam Admi Bima Yojana (AABY)
3.123 Government of India has launched a new insurance scheme called Aam Admi Bima Yojana (AABY) for the rural landless households in the country during 2007-08. As per the scheme, the head of rural landless families or one earning member in each such family will be insured. The premium under the scheme is र 200/-. The Scheme is implemented through CHIAK. Central Government provides 50% of the premium directly to the insurance agency as subsidy from the fund created for this purpose and the remaining 50% is State Government contribution. As per the scheme, the following benefits shall be given.
a. For natural death र 30,000/-
b. For accident death र 75,000/-
c. For permanent total disability due to accident र 75,000/-
d. Disability due to accident (Loss of one eye or one limb) र 37,500/-
e. Scholarship for 2 children @ रर100/month for a child र 200/- per month
The number of beneficiaries under the scheme is approximately 7, 00,000 Families
Migrant Labour into Kerala
3.124 As per 2001 census, 1.3 per cent of the population in Kerala are migrants. A recent trend in the employment sector in the State is the inflow of interstate migrant labour from Bangladesh, West Bengal, Bihar, Orissa, Chattisgarh and Jharkhand besides from the adjacent States. These workers form the less advantaged groups in the labour market and work for subsistence living. Since they are not engaged through a contractor or an intermediary, the legal protection envisaged under the Interstate Migrant Workmen (Regulation of Employment and conditions of Service) Act, 1979 is not available to them.
3.125 Though these workers are predominantly engaged in construction, plywood and steel industries, their presence is noticeable in almost all sectors including service sector in the State. They are prefered by employers as they charge low levels of wages; and they do not have the support of a Trade Union. Most of the Inter State Migrant workers have no proper shelter and are forced to live in unhygienic residential areas without proper sanitation and safe drinking water resulting in spread of communicable diseases and other social problems in the society. The Government proposes to provide them decent working condition and cost effective accommodation with all necessary amenities close to their workplace under a Private Public Partnership (PPP) arrangement. As a pilot project, efforts will be initiated for the establishment of Labour Shelters in the Corporation area or immediate surroundings of areas where Migrant Labour is concentrated. The project details and modalities for implementation have to be worked out. The Building and other Construction Workers Welfare Board will be authorised for the identification of land and further follow up action for implementation of the programme. The percentage distribution of interstate migrant workers in the districts of Kerala is given in the Fig 3.7
Fig 3.7
Percentage Distribution of Interstate Migrant workers in Kerala during 2011
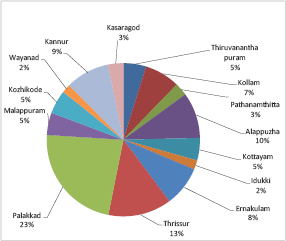
3.126 Palakkad district accounted for the largest number and Idukki is the least number of interstate migrant labourers in Kerala.
Industrial Training Department
3.127 Industrial Training Department conducts Craftsman training scheme through Government and Private ITIs and Apprenticeship Training scheme through RI Centres. There are 72 Government ITIs, one Basic Training Centre, Two AVTS, One Staff Training Institute, 454 Private ITIs and 44 ITIs under Scheduled Caste Development Department exclusively for SC and 3 ITIs under Scheduled Tribe Development Department exclusively for ST candidates functioning in the State. The total seat capacity of these ITIs is 61,145 (approximately). The Apprenticeship Training Scheme under Apprenticeship Act 1961 is being implemented through 14 Centres (9 RI Centres and 5 ITIs). During the last five years, 39 new Government ITIs established and Ten ITIs upgraded to first grade ITIs and Twelve ITIs into Centres of Excellence. And also 128 ITIs were sanctioned in the private sector.
3.128 During 2011-12 an amount of र 69.79 crore has been allotted to the Department and the expenditure reported during that period was only र 11.09 lakh (15.9 %.). The amount allotted to the Department for the Skill Development Programme during that period (र 29.94 crore ) has not been expended by the Department due to certain technical issues and hence the poor expenditure.
3.129 During 2012-13 the objective of the Department is to improve the quality of service rendered and to achieve placement for all passed out trainees. An amount of र 79.55 crore provided for the Department during 2012-13 and the expenditure reported as on 30.12.2012 is 22.18 crore (28%) by the Department.
Training, Counselling and Placement Cell in it is (TCPC)
3.130 NCVT during its 37th meeting held on 17.12.2007, decided for setting up of placement cells in each it is with suggested functions to help the graduates in getting placement in different industries. Moreover this is mandatory under the Vocational Training Improvement Project. There are 76 Government ITIs with total seating capacity of 25000 (approximately) in the State. At present, the Placement Cells in these ITIs are functioning without proper infrastructure. Based on the recommendations of the NCVT, Director General of Employment and Training has issued directions vide circular No. DGE&T 19(28)/2007-CD dated 26.07.2008, to take necessary action for setting up of full fledged Training and Placement Cell in all ITIs with appropriate infrastructure including separate room, Computers with internet facilities, phone line, fax machine and the services of experts as Consultants for proper guidance.
Section 3
Unemployment Situation in Kerala
3.131 Unemployment is always a serious problem in Kerala, though an accurate estimate is difficult to obtain. From the decade of 1970’s onwards, there has been an increase in the labour supply particularly due to the increase in the number of women seeking employment. Though the supply of work seekers increased, the demand for them did not increase, which resulted in rapid rise in unemployment in Kerala. As the cost of living in Kerala, unlike many other States, is very high, youths prefer jobs, which ensure high wage. Therefore large number of unemployed persons are migrating abroad especially to Gulf countries.
3.132 As per the second Employment – Unemployment Survey conducted by the Labour Bureau, an organization under the Ministry of Labour and Employment (GOI), during the year 2011-12, Kerala is placed in fourth position in the case of high unemployment with an Unemployment Rate (UR) of 9.9 per cent behind three small States viz; Goa (17.9 per cent), Tripura (14.1 per cent) and Sikkim (12.6 per cent). According to the current daily status (CDS) approach, Kerala (14.3 per cent) is in the second position behind Tripura (17.2 per cent). This indicates that among the larger Indian States unemployment is highest in Kerala.
3.133 In Kerala, the unemployment rate is higher in urban areas as compared to rural areas under all approaches of measurement. While comparing the unemployment rate of male and female labour it is seen that UR is much higher among females as compared to males. For instance, under the UPS approach, the female UR is estimated to be 26.2 per cent whereas for males, the UR is 3.4 per cent. In urban areas, the female UR is estimated to be 37.5 per cent; whereas the same in rural area is 21.4 per cent.
3.134 The unemployment rate based on four different approaches as estimated by Labour Bureau survey during 2011-12 is given in Table 3.4. A comparison between different estimates of unemployment indicates that the CDS estimate of unemployment is the highest. This scenario reflected both in rural and urban areas. The higher unemployment rates according to the CDS approach compared to the current weekly status (CWS) and usual status approaches (UPS and UPSS) indicate a high degree of intermittent unemployment.
Table 3.4
Unemployment Rate in Kerala based on different approaches (per cent)
Approach |
Rural |
Urban | Rural + Urban | ||||||
| Male | Female | Total | Male | Female | Total | Male | Female | Total | |
UPS* |
3.2 |
21.4 | 8.2 | 4.0 | 37.5 | 14.5 | 3.4 | 26.2 | 9.9 |
UPSS* |
2.9 |
18.8 | 7.6 | 4.0 | 35.2 | 13.9 | 3.2 | 23.4 | 9.2 |
CWS* |
3.6 |
21.8 | 8.9 | 4.8 | 36.1 | 14.6 | 3.9 | 25.8 | 10.4 |
CDS* |
8.8 |
24.9 | 13.2 | 7.4 | 39.2 | 17.2 | 8.4 | 29.1 | 14.3 |
Source: Report on Second Annual Employment & Unemployment Survey,
Labour Bureau, Ministry of Labour and Employment, Govt. of India
3.135 The main data source on employment and unemployment situation in the States as well as the Country is the quinquennial household surveys conducted by National Sample Survey Organisation (NSSO). According to the latest survey conducted in 2009-10 by the NSSO, among the Indian States, the highest Unemployment Rate based on Current Daily Status approach was estimated in Kerala (16.7 per cent); followed by Nagaland (15 per cent), Tripura (14.9 per cent), Tamil Nadu (11.7 per cent) and Orissa (7.9 per cent). At the national level the unemployment rate under CDS approach was estimated at 6.6 per cent with male – 6.1 per cent and female 8.2 per cent. The unemployment rate according to Current Daily Status approach based on 2009-10 survey for each State/UT is given in the Appendix 3.54.
3.136 Some important indicators on employment/ unemployment in Kerala as per the surveys conducted in 2004-05 and 2009-10 by the NSSO are given in Appendix 3.55; which indicates that the number of unemployed having come down in the State during the five year period 2004-09, under all approaches. For example, the unemployment rate based on CDS approach among male in rural area was 21.1 per cent in 2004-05. This rate diminished to 12.9 per cent as per the 2009-10 sample survey. And in the urban areas, the UR among male decreased from 17.4 per cent to 12.1 per cent during the five-year period. Among rural female, the UR decreased from 34.6 per cent to 27.4 per cent and among urban female, from 42.3 per cent to 21.3 per cent during the same period.
3.137 Estimates on some important indicators reflecting the prevalence of employment/ unemployment in India based on the surveys conducted by the NSSO in 2004-05 and 2009-10 are given in Appendix 3.56.
Employment in the Organised Sector
3.138 In the organised sector wages are regular and working conditions are good. But in Kerala employment in the organised sector is coming down. For instance, persons employed in organised sector were 12.26 lakh in 2000 and it decreased to 11.4 lakh in 2005 and further to 10.89 lakh in 2012, a reduction of 11.2 per cent over a period of 12 years. The share of women in organized-sector employment was 41.2 per cent in 2012 March end and has remained nearly constant in recent years.
3.139 The organised sector comprises of private and public sectors, and in Kerala public sector employment is more when compared to private sector. For instance, in 2012 out of 10.89 lakh persons employed in the organised sector 5.77 lakh (53 per cent) are in public sector and 5.12 lakh (47 per cent) are in the private sector. The share of women in public sector in Kerala is about 32.1 percent; where as in the case of private sector it is 51.6 per cent. Details on employment in organised sector in Kerala are given in Fig 3.8 and Appendix 3.57. All India figures can be seen in Appendix 3.58.
Fig.3.8
Employment in the Organized Sector- Kerala
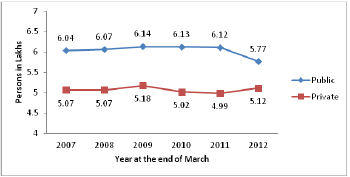
Source: Directorate of Employment, Govt. of Kerala, 2012
3.140 The branch-wise analysis of employment under public sector shows that persons employed in the Central Government offices in Kerala are decreasing over the years. At the end of March 2000 there were 86,889 central Government employees in Kerala. It declined to 76,789 in 2005 and further declined to 60,078 in 2012 (See Appendix 3.59). All India figures may be seen in Appendix 3.60.
3.141 The percentage distribution of employment in public sector as on March 31st 2012 shows that 47 per cent of employment is from the State Government, and the employment from Central Government is only 10 per cent. The share of Quasi Governments; Central and State together is 39 per cent of Public Sector employment (See Fig. 3.9).
Fig.3.9
Distribution of Employment in Public Sector- March 2012
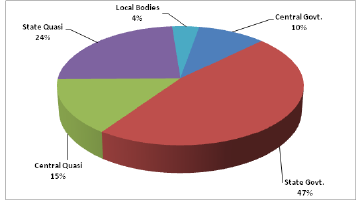
Source: Directorate of Employment, Govt. of Kerala, 2012
3.142 Data on district-wise employment in organized sector as on March 2012 indicates that the highest employment is in Ernakulam District, with 1.86 lakh persons, which accounted for 17.1 per cent of the total employment; followed by Thiruvananthapuram with 1.55 lakh persons, and Thrissur with 0.95 lakh persons. The lowest number of organized sector employment is in Wayanad district with 0.26 lakh persons, which accounted for a paltry 2.4 per cent of the total employment; preceded by Kasaragod with 0.38 lakh persons (See Appendix 3.61 & Appendix 3.62).
3.143 The sectoral distribution of workers in organised sector across different years indicates that the dependence on agriculture continues to decline. In 2011-12, the contribution of agriculture to total employment declined by approximately 0.6 per cent as compared to that in 2004-05. The share of Mining & Quarrying and the Manufacturing sector also registered a decline in 2011-12 as compared to that in 2004-05. The sectors Construction and Transport, Storage & Communication also witnessed a decrease in 2011-12. However trade, restaurants & hotels and Community, Social and Personal Services registered a marginal increase in their share in 2011-12. Electricity, Gas, Water & Sanitary Services also witnessed an increase in the share of employment (See Appendix 3.63).
3.144 Analysis of the sector-wise growth of employment in organized sector in Kerala as on March 2012 given in Appendix 3.63 revealed that the highest employment is in the community, social and personal services (45.9 per cent), followed by Manufacturing 21.5 per cent, financing and business services 8.7 per cent and Transport, Storage & Communication 8.4 per cent. All India figures are given in Appendix 3.64.
Employment in Unorganised Sector
3.145 In India, a major chunk of labor force is employed in the unorganized sector, which accounted for nearly 94 per cent of the total employment. The Sub-committee of the National Commission for Enterprises in the Unorganized Sector (NCEUS) in June 2008, estimated that the contribution of unorganized sector to GDP is about 50 per cent. Thus unorganized sector has a crucial role in our economy in terms of employment and its contribution to the National as well as State Income.
3.146 According to the latest survey on employment and unemployment carried out by the NSSO in the 66th round of NSS during July 2009 – June 2010 it is estimated, as per UPSS approach, that the self employed workers in Kerala constituted 38.4 per cent of the total workers, whereas the percentage share of regular wage/salaried employee accounted for 23.2 per cent and that of casual labour 38.4 per cent. Among self-employed workers in Kerala, about 99 per cent in the rural areas and about 97 per cent in urban areas reported to have worked in the informal sector. In the case of workers in casual labour in other than public works, about 82 per cent in rural areas and 86 per cent in urban areas reported to have worked in the informal sector. Appendix 3.65 depicts a comparison of percentages of informal sector workers under various categories in Kerala and India.
3.147 The gender differentials in the proportion of workers in the informal sector are found to be almost equal both in the rural and urban areas in the case of self-employed workers. For the regular wage/salaried employees the gender differentials are found to be narrow both in the rural and urban areas. In the case of casual labour in other than public works the gender differentials are found to be very sharp. The proportion of male casual workers employed in the informal sector far exceeded the proportion of the female casual workers: nearly 86 per cent of the rural male casual workers were engaged in informal sector, compared to 64 per cent for female and nearly 89 per cent of urban male casual workers were engaged in informal sector, compared to 67 per cent for female.
Registered Job Seekers at the Employment Exchanges
3.148 At the national level the registered job seekers have come down during the period 2006-2010. There were 414.66 lakh employment seekers in 2006. It declined to 388.18 lakh in December 2010, a reduction of 26.48 lakh over a period of four years. Of the total of 388.19 lakh job seekers as on 31.12.2010, 258.95 lakh are men (66.7 per cent) and 129.24 lakh women (33.3 per cent).
3.149 Year-wise all India registration, placement, vacancies notified, submission made and Live Register for the period 2002 to 2010 are given in Appendix 3.66.
3.150 According to live registers of employment exchanges in Kerala, the total number of work seekers as on 30th September 2012 was 45.0 lakh; of which 27.4 lakh (60.9 per cent) are female. Category-wise registered job seekers in Employment Exchanges are given in Table 3.5.
Table 3.5
Registered Job Seekers in Employment Exchanges - Kerala
(As on 30th September 2012)
Sl. No. |
Category |
Numbers |
1 |
Illiterate |
101 |
2 |
Below SSLC |
5,97,655 |
3 |
SSLC |
28,36,941 |
4 |
Higher Secondary |
7,49,262 |
| 5 | Degree | 2,66,470 |
| 6 | Post Graduates | 48,946 |
| Total | 44,99,374 | |
Source: Directorate of Employment, Govt. of Kerala, 2012
3.151 The figures in the live registers of Employment Exchanges in Kerala indicate that contrary to the all India scenario, the number of job seekers is increasing year after year (See Appendix 3.67). Youngsters register their names mainly for Govt. jobs while many of them may be engaged in some useful productive work or might have migrated either to other states or to foreign countries. At present no clear mechanism is in place to find out from the live registers of those persons who are engaged in useful productive work. Live registers should always reflect the actual unemployment position of the State so as to enable the Government to formulate policies and programmes for the real unemployed persons in a meaningful way.
3.152 Details of work seekers under the general and professional & technical categories for various years are given in Appendix 3.67. Figures indicate that the number of general work seekers has been increasing since 2005. The number of general work seekers registered their names in the employment exchanges stood at 34.93 lakh in 2005. This number increased to 43.29 lakh in 2012; showing an increase of 24 per cent during a span of seven years.
3.153 The number of work seekers below SSLC has sharply decreased from 9.52 lakh in 2000 to 5.98 lakh as on September 2012. Whereas, the total number of work seekers who possess SSLC and above has been increasing year after year. The trend of work seekers in the categories of below SSLC and SSLC & above since 2000 is shown in Fig.3.10.
Fig 3.10
Trends of work seekers in Kerala
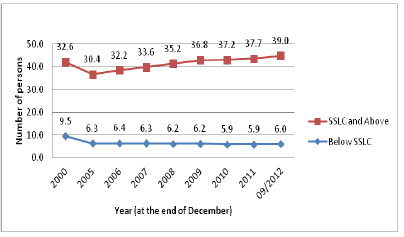
Source: Directorate of Employment, Govt. of Kerala, 2012
3.154 The number of HSC qualified candidates who have registered at the employment exchanges has increased from 5.30 lakh in 2000 to 7.49 lakh in 2012. In the case of registered graduates and post graduates the figures reveal that no significant change has been taken place during the last three years (See Appendix 3.68). Of the total employment seekers as on September 2012, 13.3 per cent is below SSLC, 63.1 per cent SSLC, 16.6 per cent HSC or equivalent, 5.9 per cent graduates and 1.1 per cent postgraduates. The percentage share of work seekers in various levels of education is given in Table 3.6.
Table 3.6
Percentage Share of Employment Seekers according to level of Education–Kerala
Sl. No |
Level of Education |
Share (Percent) | ||||
| 2008 | 2009 | 2010 | 2011 | 9/2012 | ||
1 |
Below SSLC |
15.0 | 14.5 | 13.8 | 13.5 | 13.3 |
2 |
SSLC |
61.5 | 62.2 | 62.4 | 62.8 | 63.1 |
3 |
HSC or equivalent |
16.5 | 16.5 | 16.7 | 16.6 | 16.6 |
4 |
Degree |
5.7 | 5.6 | 6.0 | 6.0 | 5.9 |
| 5 | Post Graduate | 1.3 | 1.2 | 1.1 | 1.1 | 1.1 |
| Total Work Seekers | 100.0 | 100.0 | 100.0 | 100.0 | 100.0 | |
Source: Directorate of Employment, Govt. of Kerala, 2012
3.155 The number of professional and technical work seekers as on September 2012 is 1.7 lakh. Data as on September 2012 reveal that ITI certificate holders and Diploma holders together constitute 89.1 per cent of the total professional and technical work seekers (See Table. 3.7). The figures give a clear indication that unemployment is increasing among engineering graduates. The number of registered engineering graduates in 2010 was 8143. This has increased to 14,477 as on September 2012 (See Appendix 3.69).
Table 3.7
Percentage Share of Professional and Technical work seekers in Kerala
Sl. No |
Educational Qualification |
Share (Percent) | ||||
| 2008 | 2009 | 2010 | 2011 | 9/2012 | ||
1 |
Medical Graduates |
1.6 |
1.7 |
1.4 |
1.5 |
1.7 |
2 |
Engineering Graduates |
5.5 |
6.5 |
5.4 |
6.7 |
8.5 |
3 |
Diploma holders in Engineering |
22.2 |
24.8 |
23.4 |
23.0 |
22.9 |
4 |
ITI Certificate holders |
69.8 |
66.2 |
69.3 |
68.2 |
66.2 |
5 |
Agricultural Graduates |
0.5 |
0.4 |
0.3 |
0.3 |
0.3 |
6 |
Veterinary Graduates |
0.4 |
0.4 |
0.3 |
0.3 |
0.4 |
| Total | 100.0 | 100.0 | 100.0 | 100.0 | 100.0 | |
Source: Directorate of Employment, Govt. of Kerala, 2012
3.156 A significant and peculiar feature of Kerala’s unemployment situation is that women outnumber men, among those who seek employment through employment exchanges. This position is reflected in all the 14 districts in Kerala. The district-wise unemployment of women and men in 14 districts of Kerala as on 31.03.2012 is shown in the following graph (Fig.3.11).
Fig 3.11
Work Seekers in Kerala as on 31.03.2012
(Status of Men and Women)
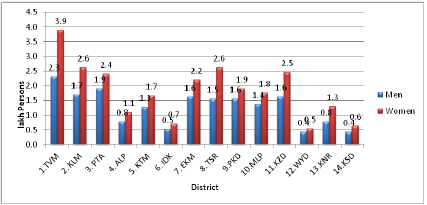
Source: Directorate of Employment, Govt. of Kerala, 2012
3.157 Thiruvananthapuram District ranks first in the number of work seekers in both general and professional categories as on 31.3.2012. The total number of work seekers in Thiruvananthapuram district is 6.2 lakh of which 3.9 lakh are women and 2.3 lakh men. The second largest number of work seekers is from Kollam district. There are 4.3 lakh job seekers in Kollam District as on March 2012, out of which 2.6 lakh are women and 1.7 lakh men. The lowest number of work seekers is in Wayanad district with 0.95 lakh numbers, preceded by Kasargod District with 1.05 lakh numbers (See Appendix 3.70).
Placement through Employment Exchanges in Kerala
3.158 The figures furnished by the Director of Employment & Training reveal that placement through Employment Exchanges in Kerala has been declining since 2000. Total placement is declined from 23,012 in 2000 to 12,150 in 2011. The placement through employment exchanges in Kerala since 2000 is illustrated in the following graph Fig.3.12.
Fig 3.12
Placement through Employment Exchanges –Kerala
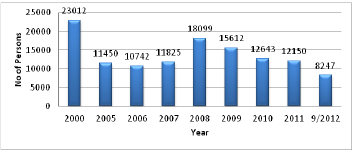
Source: Directorate of Employment, Govt. of Kerala, 2012
Performance of Kerala State Entrepreneur Self Development Mission
3.159 Kerala State Entrepreneur Self Development Mission (KSSEDM), is an ambitious scheme of the Government of Kerala, initiated by a budget announcement for the year 2011-12 and aims at inculcating entrepreneurial confidence among youth of the State by providing interest free loan up to Rs. 20 lakh for setting up micro enterprises.
3.160 The Mission aims to launch 2000 ventures every year and provide employment to 20,000 persons annually, thus generating employment potential of one lakh youths in five years. The enterprises set up under the Mission are eligible for financial assistance depending on the requirement and on the number of members in the group, at the rate of र 10 lakh per technocrat entrepreneur and Rs. 4 lakh per non-technocrat promoter. The minimum promoters’ contribution is 10 per cent and the financial assistance is to be repaid in five year, with the initial moratorium of one year. Government will bear the entire interest burden.
3.161 In the first phase, more than 10,000 prospective entrepreneurs representing 4015 enterprises registered under the Mission. Based on the project idea and the drive of the persons behind it 816 persons were selected for awarding financial assistance. The selected promoters underwent a four week training on entrepreneurship at the Rural Self Employment Training Institutes (RSETIs) followed by detailed market surveys for the product/service proposed by them. After successful completion of the training 313 enterprises involving 751 promoters were found eligible to avail financial assistance. For the 22 enterprises that have started commercial operation, an amount of र 174.94 lakh out of the sanctioned amount of र 202.95 lakh has been released. Achievements under the programme are summarised in Table 3.8.
Table 3.8
Achievement of Kerala State Entrepreneur Self Development Mission
Sl No |
Particulars |
No. of enterprises | Promoters associated with these enterprises |
1 |
Trained and made eligible for availing financial assistance |
313 |
751 |
2 |
Started commercial operation |
22 |
50 |
3 |
Being implemented with financial assistance sanctioned |
63 |
169 |
4 |
Applications for financial assistance being processed by various funding agencies |
88 |
219 |
Source: Kerala Financial Corporation
3.162 Going by the figures, the Mission’s performance in its first year is quite impressive even though it failed to achieve the target fixed for the first year. According to Kerala Financial Corporation, which is the nodal agency of the programme, the reluctance on the part of educated youth in the State to set up enterprises of their own is still seen and fresh registers are few. It can be hoped that the successes of the initial batches will prompt more capable educated and unemployed youth to take up entrepreneurship in the coming months and thus enable the Mission to achieve its objectives.
Outlook for Industry, Labour and Employment in Kerala
3.163 The increased likelihood of Central Assistance for setting up a NIMZ (Kochi-Palakkad); food processing industry support through State Food Processing Mission; increase in funds for common infrastructure in MSMEs and soft intervention in Clusters etc. need to be tapped fully so that there is greater value added to the industrial sector. Innovative funding mechanisms being promoted by the Centre such as angel funds and venture capital can be tapped by entrepreneurs in Kerala. The enhanced use of Coir geo-textiles in rural roads will provide a boost to the ailing Coir sector. Improved logistics, infrastructure development and demand led skill development will also reduce the cost of production and make industry competitive. However, focus would continue to be on pollution free light manufacturing and traditional industries, with ethical and fair labour standards.
3.164 Kerala is already a model among emerging countries when it comes to provision of acceptable standards of welfare for workers. Neventheless, special care has to be taken to ensure that dignity of labour is enhanced both by improving their skills so that they can get higher remuneration and by making them a partner in the growth process. Inter state migrants are flocking to Kerala for employment. Their welfare and integration in Kerala society requires attention. Further, a wide range of employment avenues customized to Kerala’s work force, including self employment opportunities will be required. The government, both at the central and State level are concerned about the phenomenon of jobless growth and various skill development programmes aimed at increasing the skill sets of the work force are being given the thrust it deserves. Kerala’s work force has to equip itself with skills and mindset that enhance high productivity and creativity. This will enable them to enjoy a much better standard of living. The State will continue to ensure that the interests of Kerala’s labour force is not compromised in the development of the State.