Chapter 4
SOCIAL SERVICE

Introduction
Kerala can justifiably be considered on par with many developed countries when it comes to attainment of basic social indicators. The Central 12th Plan document clearly brings out that Kerala is way ahead of all of all human and social indicators ( such as infant health, maternal health, education and women’s welfare). However, the availability of clean drinking water has been indicated as a problem in Kerala on account of great reliance on well water. Despite high achievements, complacency may not be in order. It is time to leverage the lead that has been accomplished and focus on second generation reforms which ensure that higher education is attuned to global employment opportunities, emerging life style diseases and ageing related ailments are tackled effectively, inter-se disparities between districts and communities are bridged and gender issues are sensitively dealt with. This Chapter includes Education (Section 1), Art and Culture (Section 2), Health (Section 3), Social Security and Welfare (Section 4), Provision of Drinking Water (Section 5), Gender Development (Section 6) and Development of Weaker Sections (SC /ST/Minorities) in Section 7, through a variety of social welfare schemes implemented by Government funded departments/institutions. The critical importance of this sector in Kerala, the main accomplishments during the 11th Plan (2007-2012), challenges faced by the sector and some of the major schemes introduced to tackle these challenges are brought out in this chapter.
.
Education
Kerala has a unique place in the educational map of India. Educational initiatives spearheaded by various agencies for the last one century made Kerala the most literate state in India. The educational efforts during this period sought to make education a mass- based social good.
4.2 Public spending on education has been more or less equitably distributed between the sexes and among different social groups and regions in the state. The state is making concerted efforts in sustaining the achievements in the elementary education sector and improving the quality of secondary, higher, technical education and research.
Expenditure on Education
4.3 A sum of र1325.7 crore had been earmarked for Education sector during XIth five year plan and109 percent of total outlay on education was expended during the period. The percentage increase of outlay over Xth plan is 106 percent and the corresponding increase in expenditure is129 percent. During Xth & XIth five year plans 2.6 percent and 3 percent of the total plan outlay was earmarked for the sector. During the XIth plan period more emphasis was given to General education subsector. The details are given in Table 4.1
Table – 4.1
Plan Outlay & Expenditure during Xth& XIth plan
(र in crore)
Stages |
Xth plan outlay |
Xth plan |
Per cent |
XI th plan outlay | XI th plan expenditure | per cent Exp |
General Education |
189.2 |
241.2 |
127 |
711.8 |
615 |
86 |
University and Higher Education |
161.6 |
149.7 |
93 |
345.2 |
453.8 |
131 |
Technical Education |
292.5 |
242.5 |
83 |
268.1 |
381.36 |
142 |
| TOTAL | 643.3 | 633.4 | 98 | 1325.7 | 1450.2 | 109 |
| Grand Total( Five year plan) | 25226 | 20588.9 | 82 | 45605.5 | 39661 | 87 |
Literacy
4.4 Higher levels of literacy and education lead to better attainment of health and nutritional status, economic growth, population control, empowerment of the weaker sections and community as a whole. Also, higher literacy rates improve development indicators consistently. It acts as a catalyst for social upliftment enhancing the returns on investment made in almost every aspect of development effort. Literacy is a basic step towards education, which is a process of life long learning and an entry point to the world of communication and information.
4.5 Kerala has ranks first in the country with a literacy rate of nearing 94 per cent. Kerala’s literacy rate is comparable to the most advanced regions of the world. Kerala holds the first rank in the country in female literacy with 92 per cent. The literacy rates for rural population are also highest in Kerala. Kerala’s literacy rate from 1951-2011 is given in Appendix.4.1.Statewise comparison of literacy rates in Southern India is given in the Fig. 4.1
Fig. 4.1
State Wise Comparison of Literacy Rates in Southern India
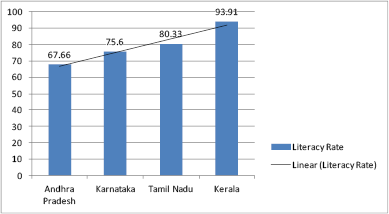
Source: Census 2011
4.6 District wise analysis of Kerala’s literacy rate shows that Pathanamthitta district (97 percent) has the highest literacy rate in the State followed by Alappuzha and Kottayam with 96.5 percent each. Palakkad district has the lowest literacy rate in the State (89 percent). Literacy rate by sex for districts in 2001 and 2012 are given in Appendix 4.2.
4.7 Kerala State Literacy Mission is implementing literacy and equivalency programmes by appointing ‘Preraks’ (motivators). Details of the number of people benefited from Equivalency programme of Literacy Mission from 2002-03 to 2011-12 are given in Appendix 4.3.
Right to Education Act
4.8 From April 1, 2010 the Right to Education has come into force ensuring free education to more than 92 lakh out-of-school children in India. This Act gives every child the right to a quality elementary education. The following are the main features of the Act:
• All children aged 6-14 shall have the right to free and compulsory education at a
neighbourhood school.
• No direct (school fees) or indirect cost on uniforms, textbooks, mid-day meals, transportation
etc needs to be borne by the child or parents to obtain elementary education.
• The Government will provide schooling free of cost until the child’s elementary education is completed.
• All schools must comply with certain infrastructure and teacher norms. Two trained teachers
will be provided for every 60 students at the primary level.
• Schools shall constitute School Management Committees(SMC) comprising local officials,
parents, guardians and teachers. The SMCs will monitor utilization of govt grants and the
school environment.
• RTE mandates inclusion of 50 per cent women and parents of children from disadvantaged groups in SMCs.

School Education
4.9 There were 12644 schools in Kerala during 2011-12. Out of these 4620 were government schools, 7161 aided schools and 863 unaided schools. During 2011-12, 56.6 per cent of total schools were aided schools, 36.5 per cent government schools and 6.8 per cent unaided schools. Compared to Government upper primary and high schools more number of Lower Primary schools are functioning under Government sector. Aided schools outnumber government schools in all sections.
4.10 Malappuram District has the largest number of schools (1472) in the State followed by Kannur (1293) and Kozhikode (1237). Malappuram District has also the largest number of government (546) and unaided schools (145) in the State. But largest number of aided schools is functioning in Kannur district (961). Details of district-wise, management wise and stage-wise number of schools in Kerala during 2011-12 are given in Appendix 4.4.
4.11 In the State 946 schools are offering syllabus other than the one prescribed by the State Government. These include 797 CBSE schools, 108 ICSE schools, 27 Kendriya Vidhyalaya and 14 Jawahar Navodayas. One Jawahar Navodaya Vidhyalaya schools each is functioning in all the districts. District-wise details of schools with syllabus other than state syllabus in the year 2011-12 are given in Appendix 4.5.
Physical Infrastructure and Facilities in Government Schools
4.12 Most of Government Schools including all LP schools in Kerala are functioning in pucca buildings. Three high schools are in thatched sheds and they are situated in Thiruvananthapuram District. Own buildings have to be constructed for 162 government schools which are now working in rented buildings. District-wise details of government schools having building facilities are given in Appendix 4.6
4.13 Local Self Government Institutions and programmes like Sarva Shiksha Abhiyan( SSA) have contributed much to the overall development and improvement of physical infrastructure and common facilities in Government schools in the state. Data available in 2012 shows that 99 per cent of government schools have access to drinking water and 99.7 per cent of Government schools in the state have urinals/latrine facilities. District –wise details of Government schools having drinking water/latrines/urinal facilities in Kerala in 2012 are given in Appendix 4.7.
Enrolment of Students
4.14 Enrolment of students in 2012-13 was 39.86 lakh in 2011-12 and has decreased by nearly 6 percent over the previous year. Change in demographic pattern of the state due to low birth rate is the main reason attributed for this phenomenon. The decline of students in LP section is 135000 numbers in 2012-13 from 2011-12. while the decline in Upper Primary ( UP) section is 93000 numbers in 2012-13, and the High School(HS) section shows a decrease of 19000 students over the previous year. The stage-wise enrolment of students in schools in Kerala from 2008-09 to 2012-13 are given in Appendix 4.8. Details of management-wise and standard wise enrolment of students in schools in Kerala during 2011-12 are given in Appendix 4.9. District-wise and stage-wise enrolment of students in schools in the state during 2012-13 is given in Appendix 4.10. The decrease in the enrollment of students in LP school is shown in Fig.- 4.2
Fig 4.2
Enrollment of Students in School
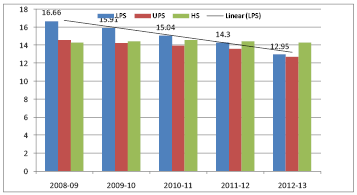
Source: Directorate of Public Instructions
Enrolment of Girl students
4.15 Girl students constitute 49.4 percent of the total student enrolment in schools. Boys outnumbered girl students in all the districts except in Thiruvananthapuram and Kollam. Generally, in Kerala, there is a more or less uniform pattern in the enrolment of girl students across districts.
SC/ST Enrolment
4.16 As per the figures of 2012-13, SC students constitute 11percent of total students in the State. The percentage of SC students in government schools, private aided schools and private unaided schools are 14 percent, 10.8 percent and 3.9 percent respectively.
4.17 ST students constituted 2 per cent of total enrolment in schools in the year 2012-13. The percentage of ST students in government schools, private aided schools and private unaided schools are 3.7 percent 1.4 percent and 0.3 percent respectively in 2012-13. The standard-wise strength of SC/ST students in the state in 2012-13is given in Appendix 4.11.
Drop-out rate
5.18 Kerala has achieved the distinction of having the lowest dropout rate of school students among the Indian states. In the year 2010-11, dropout ratio among school students in Kerala was only 0.53 per cent. The dropout ratio in High school stage is higher than that of LP/UP stage .The dropout ratio in UP stage is negligible when compared to that of High school stage.
4.19 Among the Districts, Wayanad has the highest dropout ratio in the lower primary section (1.2 per cent ),upper primary section (1 per cent ) and high school section(2.2 per cent ).All most all other District have dropout ratio is less than 0.50 per cent in the three stages.District-wise/stage-wise dropout ratio in schools in 2010-11 is given in Appendix 4.12. Drop-out ratio among SC students in Kerala as per the figures of 2010-11 was below 1 per cent and that of ST students was more than 2 per cent. District wise and stage wise details of drop out among SC and ST students in Kerala for the year 2010-11 are given in Appendices 4.13 and 4.14.
Number of Teachers
4.20 The number of school teachers in Kerala includingTeachers Training Institute( TTI) teachers during 2011-12 was 166939. Out of this 101365(60.7 per cent ) teachers are working in aided schools and 13221 teachers are working in private unaided schools. The remaining 31.4 per cent of teachers are working in government schools. About 50 per cent of total teachers in the state are teaching in high schools, 25 per cent in upper primary schools, 23 per cent in lower primary schools and the remaining in TTI’s. 71.5 per cent of total teachers in the state are women. Stage-wise and management-wise number of teachers in Kerala during 2011-12 is given in Appendix 4.15.
Uneconomic Schools
4.21 Schools with insufficient strength of pupils are termed as uneconomic schools. There are 4614 uneconomic schools in Kerala as per the figures of 2011-12, which registered an increase of 334 schools over previous year. Out of these , 2271 are government schools and 2343 are in the aided sector. District-wise analysis shows that highest number of uneconomic schools is in Kannur district (685). In government sector Ernakulam district has the largest (260) number of uneconomic schools followed by Kottayam district (245 ). Among the Government uneconomic schools, 75.7 per cent are of lower primary schools. In the aided sector also 87.3 per cent of uneconomic schools are lower primary schools. District wise details of uneconomic schools in the State in 2011-12 are given in Appendix 4.16.
Sarva Shiksha Abhiyan(SSA)
4.22 The Sarva Shiksha Abhiyaan is also known as the Education for All movement or ‘Each One Teach One’. It was introduced in 2000-2001 as the flagship programme run by the Government of India. This scheme is framed to provide useful and relevant elementary education for all children in the age group of 6 to 14 by 2010 irrespective of any social, regional, economic and gender barriers, with the active participation of the community in the management schools. It encompasses all activities of school education-providing physical infrastructure, free text book for children, encouraging enrolment of girls and teacher training. The fund sharing between the central and the states was 75:25 in the Tenth Plan. The funding pattern for the Eleventh Plan was modified to 65:35
4.23 Total allocation provided to SSA including central and state share during the XIth plan is Rs.1152.34 crore and an amount of Rs.1020.33 crore was expended, which constitute 88.5 per cent of the outlay.The financial progress of the scheme during the Eleventh Plan is given in Table 4.2
Table- 4.2
Outlay and Expenditure of SSA
Allocation and Expenditure (र in Crore) |
2007-08 |
2008-09 |
2009-10 |
2010-11 |
2011-12 |
Total |
GOI Release |
103.23 |
108.54 |
119.89 |
196.60 |
197.22 |
725.48 |
GOK(including LSG) Release |
48.20 |
61.43 |
68.81 |
133.66 |
114.76 |
426.86 |
Total Expenditure |
137.60 |
176.95 |
192.33 |
251.26 |
262.19 |
1020.33 |
Source: Sarva Shiksha Abhiyaan,Kerala
4.24 The landmark achievements of SSA are the following
• The constitutional commitment on Universalisation of Elementary Education has been fulfilled and that Kerala has enrolled all children in the age group 6-14
• The multipronged interventions led to reduction of dropouts
• No gender gap exists on enrolment among different social groups
• As per the index prepared by National University of Educational Planning and Administration(NUEPA), Kerala leads in upper primary education and second in lower primary education in the country
• Under computer education 2000 computers were provided in UP schools and more than 35000 UP teachers were trained during 2002-2011.
Higher Secondary Education
4.25 Education after the first 10 years was a part of the higher education system for many decades. Higher Secondary courses were introduced in the state during 1990-91 to reorganize the secondary level of education in accordance with National Education Policy. Higher Secondary Course is the turning point in the entire school education in our state. The department serves as a professional institution in formulating and maintaining the standards of Higher Secondary Education and in providing need based timely, scientific, effective and sustainable services to the students and teachers at the Higher Secondary level.
4.26 In the State,1836 Higher Secondary schools were functioning in 2012. Out of these 755 (41.2 per cent) are Government schools, 668 (36.4 per cent) are Aided schools and the remaining 413 (22.5 per cent) are Unaided schools. Among the districts Kozhikkode has the largest number of Higher Secondary schools (223 ) in the state followed byThrissur and Ernakulam (176 each) districts respectively.
4.27 There are 6554 batches for higher secondary courses in 2012. The total number of enrolment of students in Higher Secondary Schools was 329674 and it registered an increase of 2 per cent over the previous year. Kozhikkode district had the largest no of batches (914) with an enrolment capacity of 46004 students. District wise/Management-wise number of higher secondary schools and number of batches are given in Appendix-4.17 and District wise enrolments of students in higher secondary schools are given in Appendix 4.18.
4.28 The pass percentage of students in higher secondary courses has increased to 88 per cent in 2011-12 from 82 per cent in 2010-11.The pass percentage of SC and ST students in Higher Secondary schools also increased in 2011-12 compared to 2010-11. During 2012, 3593 students got A+ for all subjects and 258233 students were eligible for higher studies. The details are given in Appendices 4.19 & 4.20.The pass percentage of SC students also increased from 60 per cent to 75 per cent and ST students from 52 per cent to71 per cent during 2011-12. Details are given in Appendices 4.21 and 4.22.The achievements during the reporting period is given in Box 4.1
Box 4.1
Major Achievements under Higher Secondary Education in 2011-12
• All the Government/aided/unaided higher secondary teachers (23452nos) were imparted 3-days content based comprehensive training programmes.
• Through the merit cum means scholarship programme,9900 scholarships were distributed to the students of BPL families.
• Remedial coaching to 5333 students of 41 schools was imparted. This has resulted in a pass percentage between 50 and 98 percentage.
Source: Directorate of Higher Secondary Education
Vocational Higher Secondary Education
4.29 Vocational Higher Secondary Education was introduced in the state in 1983-84 Vocational Higher Secondary Education is impart on at plus two level with the objective to achieve self/wages/direct employment as well as vertical mobility. Vocational Higher Secondary Schools numbered 389 in the State with a total of 1099 batches. Out of these Schools 261 are in the Government sector and 128 in the Aided sector. Kollam District (52 ) has the largest number of Vocational Higher Secondary Schools in the State. District wise details of Vocational Higher Secondary Schools and courses during 2011-12 are given in Appendix. 4.23.
4.30 The percentage of students eligible for higher education in Vocational Higher Secondary examination in 2012 March is nearly 85 percent, while the pass percentage in 2011 March was 80.5 per cent. The number of students who appeared and those who passed Vocational Higher Secondary examination from the year 2007 to 2012 and the results of school going students are given in Appendices 4.24 & 4.25.
University and Higher Education
4.31 There are a total of 9 universities functioning in the State. Out of these, four universities viz. Kerala, Mahatma Gandhi, Calicut and Kannur are general in nature and are offering various courses. Sree Sankaracharya University of Sanskrit, Cochin University of Science and Technology and Kerala Agricultural University offer specialized courses in specified subject areas. Besides these, the National University of Advanced Legal Studies (NUALS) established in 2005 and the Central University established in Kasargode district are also functioning.
4.32 The various programmes that have been included in the State Plan have a significant impact in the overall performances of the universities. Programmes such as the Erudite, Aspire (scholarship to researchers and PG students to undertake short term research programmes within research institutions and universities in India), and Acquire for social science have been implemented in the universities. The presence of Nobel laureates and other eminent academicians as scholars in residence for longer periods (up to 15 days) has a significant impact in the university community The various scholarships for fostering excellence in studies also have a significant impact among the student community.
4.33 Inter University Centres within the Universities in Kerala were established in 2009. These centres provide academic support to the faculty and students of various universities and co-ordinate major projects undertaken in their respective fields. The Inter University Centre has the objective of developing post graduate programmes in the relevant discipline and serving as an Inter University Centre for research and strengthening the ongoing Ph.D programmes and research activity in the concerned areas of advanced study
Grant to Universities
4.34 The State Government provides Plan and Non plan grants to universities which are a major source of their revenue. र400 crore is earmarked as grant to universities in the year 2012-13. Out of this, र 304.29 crore (76 per cent) is provided under non plan head and र 95.50 crore is earmarked under plan head. Kerala University has received the maximum assistance from state government in the year 2012-13. In the current year, 38 per cent increase is registered in financial assistance to Universities over 2011-12 revised estimate. Details are given in Table. 4.3
Table 4.3
Plan and Non Plan Grant to Universities in Kerala
(रCrore)
University |
2010-11 Accounts | 2011-12 Revised Estimate | 2012-13 Budget Estimate | ||||||
Plan |
Non Plan | Total | Plan | Non Plan | Total | Plan | Non Plan | Total |
|
Kerala |
21.3 |
74.45 |
95.75 |
12 | 89.34 | 101.34 | 17 |
110.99 |
127.99 |
Calicut |
13.02 |
54.08 |
67.10 |
12 | 37.18 | 49.18 | 17 |
79.81 |
96.81 |
| Mahatma Gandhi | 14.54 | 31.00 | 45.54 | 12 | 37.18 | 49.18 | 17 | 45.28 | 62.28 |
| Sree Sankaracharya | 8.55 | 16.38 | 24.93 | 8 | 17.02 | 25.02 | 11 | 21.80 | 32.80 |
| Kannur | 34 | 9.72 | 43.72 | 12 | 8.44 | 20.44 | 17 | 10.41 | 27.41 |
| Cochin University of Science and Technology (CUSAT) | 21.13 | 24.48 | 45.61 | 12.01 | 29.26 | 41.27 | 13 | 36 | 49 |
| National University of Advanced Legal Studies | 2.70 | 0 | 2.7 | 3 | 0 | 3 | 3.5 | 0 | 3.50 |
Total |
115.24 |
210.11 |
325.35 |
71.01 | 218.42 | 289.43 | 95.50 |
304.29 |
399.79 |
Source: Detailed Budget Estimates 2012-13, Vol .1 Government of Kerala
Arts and Science Colleges
4.35 Including 150 Private Aided Colleges and 41 Government Colleges there are 191 Arts and Science Colleges in the State. Ernakulam district (25) has the largest number of Arts and Science colleges in the State followed by Kottayam (22 ), Thiruvananthapuram (20 ) and Thrissur (20 ) districts. Thiruvananthapuram district has the largest number of Government colleges (8 ) in the State. District-wise number of Arts and Science colleges in the State in 2012 is given in Appendix 4.26
Enrolment of Students
4.36 The total number of students enrolled in various Arts and Science colleges (excluding unaided colleges) under the four general universities in Kerala during 2011-12 is 1.82 lakh. Of this 1.27 lakh (69.8 per cent) are girls.
4.37 Out of the total 1.66 lakh students enrolled for degree courses, 45 per cent are enrolled for BA degree courses, 39.5 per cent enrolled for BSc degree courses and 15.5 per cent enrolled for B.Com degree courses. Girls constitute 68.8 per cent of total enrolment for degree courses. 27 subjects are offered for BA degree courses. Among the subjects, Economics has the largest number of enrolment of students. 31 subjects are offered for BSc course and Mathematics has the largest number of student enrolment. Details of enrolment of students in Arts and Science colleges for BA, BSc and B.Com are given in Appendices 4.27 to 4.29. 15665 students were admitted to post graduate course in the State in 2011-12. 78.6 per cent of those enrolled in PG courses are girls. Details of enrolment of students in Arts and Science colleges for MA, MSc and M.Com courses are given in Appendiices. 4.30 to 4.32.
SC, ST Students
4.38 The enrolment of SC students in degree and post graduate courses is 23680 and 1739 respectively. SC students constitute nearly by 14 percent of total students in 2011-12. Girls’ students constitute 65.6 per cent of total SC students in Arts and Science colleges.
4.39 2914 Scheduled Tribe students were enrolled for courses in arts and science colleges in 2011-12. The enrolment of ST students in degree and post graduate courses are 2555 and 359 respectively. Girls constitute 60 per cent of total ST students in Arts and Science colleges. Enrolment of SC and ST students in Arts and Science Colleges in Kerala during 2011-12 is given in Appendix. 4.33.
Scholarships
4.40 About 16 type of central and State sector scholarships are given to students. Various scholarships including merit cum means scholarships (558 nos) and post metric scholarships (65418 nos) are given during 2011-12. The Directorate of Collegiate Education has erected LED display board giving the details of scholarships offered by the Government of Kerala and India. The details of number of scholarships given from 2009-10 to 2011-12 is given in Appendix 4.34
Teachers
4.41 The number of teachers in Arts and Science colleges in 2011-12 was 8927. Out of this 47.5 per cent are women. University-wise number of teachers in Arts and Science colleges in the year 2009-10, 2010-11 and 2011-12 is given in Appendix.4.35. 4336 teachers in Arts and Science colleges in the State have Ph.D degree. Details are given in Appendix 4.36. A total of 1757 Guest Lecturers were working in Arts and Science colleges of the state in 2012. Details are given in Appendix. 4.37.
Kerala Council for Historical Research (KCHR)
4.42 Kerala Council for Historical Research is an autonomous academic institution committed to scientific research in History and Social Sciences. It is a recognized research centre of the University of Kerala and has academic affiliations with leading research institutions and universities inside and outside the country. KCHR is to publish a comprehensive volume on the scientific history of Kerala from pre-historic to the present times.
4.43 A sustainable/historical tourism project is conceived in the Kodungallur-Parur zone and KCHR is identified as the nodal agency to provide technical assistance. From 2006-07 onwards KCHR has successfully undertaken the multi disciplinary excavation at Pattanam. The excavation has yielded significant evidences for re-conceptualizing the early history of Kerala. The major findings of the excavation are listed below in Box 4.2
Box 4.2
Major Findings of the Excavation
a) Pottery: rim sherds -27907, lid sherds-410, sherds with garaffiti-13. Unclassified distinct potsherds – 2000
b) Beads: -20142(including 1834 broken beads) ,Semiprecious stone beads-214 , bead blanks-9. Beads of beryl, carnelian, garnet, quarts, chalcedony, amethyst, agate, crystal, topaz and small number of unknown varieties were excavated.
c) Metal objects
Iron nails,fragments-1123,fragments of unidentified iron objects-396,Iron slag piece-47,Copper nails-3,Copper objects-57, Lead objects-18,Lead scrolls-4 , crucible frgments-24 and tiny fragments of ornaments, bits etc of gold-25,Copper coins-17
d) Terracotta artifacts
Rings of a ring well-4 nos, lamps-15, beads-9, balls - 5 stoppers-4
Source: Kerala Council for Historical Research
Technical Education
4.44 Directorate of Technical Education is the nodal department for Technical Education in the State. As envisaged in the 12th plan, the basic objective is to achieve faster, sustainable and more inclusive growth. The details of technical institutions under the administrative and financial control of Directorate of Technical Education is given in Table- 4.4
Table – 4.4
Technical Institutions under Directorate of Technical Education-2012
Sl. No. |
Institutions |
Nos |
1 |
Government Engineering Colleges |
9 |
2 |
Private Aided Engineering Colleges |
3 |
3 |
Unaided Engineering Colleges |
141 |
| 4 | Government Polytechnic Colleges | 36 |
| 5 | Government Women's Polytechnic Colleges | 7 |
| 6 | Private Aided Polytechnics | 6 |
| 7 | Fine Arts Colleges | 3 |
| 8 | Government Technical High Schools | 39 |
| 9 | Government Commercial Institutes | 17 |
| 10 | Tailoring and Garment making training centres | 42 |
| 11 | Vocational Training Centres | 4 |
| Total | 307 | |
Source: Directorate of Technical Education
4.45 Some of the major activities undertaken by the Department during 2012-13 are
• Academic Committee for polytechnic education
• Establishment of Kerala Technological University
• Scholar Support Programme
• Quality Improvement Programme Centres in two engineering colleges at Thiruvananthapuram
and Thrissur through which the faculty all over India has the opportunity to undergo PhD
programmes in these institutions
• Educational Resource Centres in all Government Engineering Colleges
• Additional Skill Acquisition Programme
• Transportation Engineering Research Centre.
Engineering Colleges
4.46 There are 153 engineering colleges in the state with a total sanctioned intake of 48988 in 2012.Out of these engineering colleges,141(92.2 per cent) are self financing colleges, 9 (5.9 per cent) are Government colleges and 3 (2. per cent) are private aided colleges. Major chunk of the unaided engineering colleges are functioning in Ernakulum District (28) followed byThiruvananthapuram (22).InPathanamthitta, Alappuzha, Malappuram and Kasargod Districts, only unaided colleges are functioning. During 2012, 11 unaided engineering colleges were newly started in the State. The District wise and management wise details of colleges and sanctioned intake are given in Appendix- 4.38
4.47 The sanctioned intake of Government colleges during 2012 was 3236 (6.6 per cent), aided colleges 1566 (3.2 per cent) and unaided colleges 44186(90.2 per cent). The sanctioned intake of unaided colleges has increased by 8.5 per cent during 2012 compared to the previous year.
4.48 Of the engineering colleges in Kerala, the largest number of branch wise seats was in Electronics and Communication (11002) followed by Computer science (8777) and Electrical and Electronics (7572). Branch-wise distribution of seats in engineering colleges in 2011-12 is given in Appendix.4.39. 4591students were studying in Government and aided engineering colleges for graduate courses in the year 2011-12 and 4763 students were newly admitted in 2012-13. Out of these nearly 40 per cent were girls. 906 students were studying in Government and aided engineering colleges for post graduate courses in the year 2011-12 and 814 students were newly admitted in 2012-13. Girl students constitute 45.3 per cent of total students in Government and aided engineering colleges studying for post graduate courses. Details are given in Appendix 4.40& 4.41.
4.49 The visiting faculty programme enables the teachers and students of the institution to share the experience and expertise of the eminent faculty from premier engineering institutions like IIT’s, IISC’s etc, research organizations like ISRO,DRDO etc. More than 200 lectures were arranged in 9 Government Engineering colleges as part of this programme during 2011-12. It is expected that this will ultimately lead to greater scope for technology incubation. The number of visiting faculty programmes in various engineering colleges during 2011-12 is shown in the Table 4.6.
Table – 4.5
Visiting Faculty Programmes in Various Engineering Colleges
Sl. No. |
Name of College |
No. of |
1 |
College of Engineering,Thiruvananthapuram |
54 |
2 |
GEC,Barton hill |
32 |
3 |
RIT,Kottayam |
9 |
| 4 | GEC,Idukki | 13 |
| 5 | GEC,Thrissur | 21 |
| 6 | GECPalakkad | 16 |
| 7 | GEC,Kozhikkodu | 8 |
| 8 | GEC,Wayanadu | 36 |
| 9 | GECKannur | 20 |
4.50 Under capacity development, 30 training programmes were organized through various agencies for the teaching and non- teaching staff and about 1000 members participated in the programme. During 2011-12, 13 faculty members were deputed for M.Tech and 27 were deputed for Ph.D programme.
4.51 Smart class rooms with all advanced teaching aids were established in all Government Engineering Colleges and polytechnics. Merit Cum Means Scholarships is given to financially weaker students belonging to the minority community. The number of scholarships allotted to Kerala is 1469.Libraries in Engineering colleges have been modernized with e-journals,e-books etc. All libraries have been computerized.
Academic Excellence in Engineering Colleges
4.52 The academic excellence in various institutions is high and appreciable and this was due to the high pass per cent and increasing placement of students in reputed firms. The pass per cent of final semester result of Government Engineering colleges during 2011 shows that the pass percentage of Government Engineering colleges,TVPM and Thrissur is more than 80 per cent.The pass percentage of GEC, Barton hill and Kozhikkode is nearly 80 per cent. All Government Engineering colleges have a pass percentage of more than 50 per cent.
4.53 The placement record of the students in various institutions is also relatively high. A large number of students are also being qualified for higher studies through competitive examinations like GATE, CAT etc. Most of the students get placement in multinational firms like WIPRO, MAHENDRA, TCS, and BOSCH etc. Placement details of students of various Government Engineering colleges during 2011 is given in the Table 4.6
Table – 4.6
Placement Details of Students of Various Government Engineering Colleges during 2011
Sl. No. |
Name of College |
No.of offers |
1 |
College of Engineering,Thiruvananthapuram |
697 |
2 |
GEC,Barton hill |
146 |
3 |
RIT,Kottayam |
9 |
| 4 | GEC,Idukki | 13 |
| 5 | GEC,Thrissur | 370 |
| 6 | GEC,Palakkad | 16 |
| 7 | GEC,Kozhikkodu | 63 |
| 8 | GEC,Wayanadu | 36 |
| 9 | GECKannur | 20 |
| TOTAL | 1370 |
|
Polytechnics and Technical High Schools
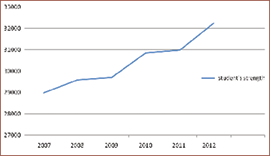
4.54 43 Government polytechnics and 6 private aided polytechnics were functioning in Kerala. The annual intake of students in Government polytechnics and private aided polytechnics are 10064 and 1544 respectively. The total number of students in Government polytechnics during the year 2012 was 27704 and that of private aided polytechnics 4536. The student’s strength shows an increasing trend during the past few years. This is due to the focussed action by the State for creating skilled manpower, enhancing industrial productivity and improving the quality of life of its people. Details of annual intake and student’s strength in polytechnics from the year 2010-11 to 2011-12 are given in Appendices 4.42 & 4.43. Details of trade-wise annual intake of students in polytechnics of the State in 2011-12 are given in Appendix 4.44. Details of students strength from 2007 to 2012 is given in Fig. 4.3.
Fig- 4.3
Student Strength in Polytechnic
4.55 Total number of teachers working in polytechnics of the state is 1998. Women teachers constitute 28 per cent of the total teachers in polytechnics. SC/ST teachers constitute 8.5 per cent of teachers. Details of number of students and teachers in polytechnics are given in Appendix 4.45. Number of SC/ST students and SC/ST teachers in polytechnics in the report year are given in Appendix. 4.46.
4.56 39 Government technical high schools are functioning in the state. Total number of students in technical high schools in the year 2011-12 was 8178, and 849 teachers were working in technical high schools of the state in the corresponding period. Women teachers constitute 21per cent of teachers in technical high schools. Number of students and teachers in technical high schools from 2010-11 to 2012-13 are given in Appendix. 4.47. SC students in technical high schools accounted for 13.7per cent of total students. ST students in technical high schools constitute 0.8per cent of total students. Details are given in Appendices 4.48 and 4.49.
XIIth Plan Initiatives
4.57 One of the major challenges of the State’s12th plan will be to address special/new problems that emerge in the Education sector and these problems are mainly second generation development problems of the State. Consequently the12th plan anticipates a major hike in the allocation of plan funds to the Education sector. The 12th plan will also make an attempt to identify and fill the critical coverage gaps in education facilities.
4.58 The effort taken in the XIth plan, especially in providing educational facilities and improving the quality of education have to be continued in the XIIth plan period to reach its full potential. The challenge that requires much greater attention in the XIIth plan is that of ensuring better implementation and improved accountability. Major initiatives to be taken in 12th plan are
• To promote total literacy among the vulnerable sections
• Special emphasis will be given to address the issue of digital divide
• Continuous modernization of schooling system
• Strengthening the noon meal pogramme
• Selected colleges will be encouraged to start innovative courses
• At least 10 colleges will be converted into Centres of Excellence
• Encourage curriculum development, innovation in teaching and training techniques.
SECTION 2
Art & Culture
4.59 God’s own country, Kerala has a rich heritage of art and culture. This sector plays an important role in the economy by creating not only a sense of pride in our heritage but also by creating income and employment. There are many institutions solely set apart for the promotion and encouragement of these art forms. Major activities conducted in this sector during 2012 are Viswa Sahitya Malayala Mahotsavam and International Film Festival.
4.60 Viswa Sahitya Malayala Mahotsavam is an event organized jointly by Kerala Sahitya Academy and Department of Cultural Affairs.There were literary seminars and poetry sessions as part of the three day festival. There were also dialogues with writers from Kerala and outside and great men of Malayalam Literature were honoured. Book fair and cultural performances were the other attractions of the festival.
4.61 The 17th International Film Festival of Kerala held at Thiruvananthapuram was organised by Kerala State Chalachitra Academy on behalf of Cultural Affairs Department. Contemporary World cinema,
New Malayalam Cinema, retrospective of major film makers etc are screened during this festival.
Cultural Policy
4.62 For the comprehensive development of the art and culture sector State Government has formulated a Cultural Policy. Cultural Policy enables people to satisfactorily participate in the cultural life without any discrimination on the basis of caste and creed. The main features are:
l It creates an opportunity for the people especially youth for engaging in creative works and
leading a value –based life.
l Education, science and art are closely related with culture. A comprehensive development of
society requires interconnected relations of these sectors. Co-ordinating the activities of Cultural
Affairs department, Education department, Science &Technology department and industry
department are a pre- requisite to holistic cultural development.
l This policy aims to respect cultural diversity and include it in the curriculum (at primary &
secondary level) as a part of National Education Policy.
l Many cultural institutions are active in Kerala but activities of these institutions do not reach all
areas .Decentralisation and people participation are to be encouraged.
l Steps should be taken to preserve archives, monuments, historic places, archaeology, public-
private historical and cultural documents.
SECTION 3
Medical and Public health
4.63 The National Health Policy envisages a three tier structure comprising of the primary, secondary
and tertiary health care facilities to bring health care services within the reach of the people. The primary tier is designed to have three types of health care institutions, namely, a Sub-Centre for a population of 3000-5000, a Primary Health Centre (PHC) for 20000 to 30000 people and a Community Health Centre (CHC) as referral centre for every four PHCs covering a population of 80,000 to 1.2 lakh. The district hospitals are to function as the secondary tier for the rural health care, and as the primary tier for the urban population. The tertiary health care is to be provided by health care institutions in urban areas which are well equipped with sophisticated diagnostic and investigative facilities. The National Health Policy 2002 aims to achieve acceptable standards of good health among the general population of the country. One of the key focus areas of the country today is making healthcare affordable and accessible for all its citizens. India lacks strong healthcare infrastructure. Though the overall level of funding allocated for healthcare nationally is comparatively high (4.1 per cent of GDP), the Government’s funding is low (<1 per cent of GDP) compared to other emerging nations. The 12th plan aims to increase the allocation to Health sector from 1.4 per cent of GDP to 2.5 per cent.
4.64 Kerala is one State where private health sector, both indigenous and Western systems of medicine, have played a crucial role. India is undergoing an epidemiologic, demographic and health transition. At present, out of the total health care institutions in the State 46 per cent are under Allopathy, 32.2 per cent under Ayurveda and 22 per cent under Homoeopathy department. The expectancy of life has increased, with consequent rise in degenerative diseases of aging and life-styles. Nevertheless, communicable diseases are still dominant and constitute major public health issues. Changes in dietary habits and increased tobacco/ alcohol use are likely to increase the incidence of chronic diseases in future and the State needs to build in measures to manage these into the primary health care system. Similarly mental health also deserves special attention. Addressing these issues would require the State to harness high technical and managerial expertise.
Success Indicators of Kerala Health Model
4.65 In Kerala, a person at birth is expected to live for 74 years, while in States like Bihar, Assam, Madhya Pradesh and Uttar Pradesh, the expectancy is in the range of 58-61 years. Among the four Southern States, Kerala and Tamil Nadu have already achieved the goal of a MMR of 100 per lakh live
births but, within the group, Karnataka lags significantly behind with a MMR of 178 per lakh live births and at current rate of decline would only reach to about 130 per lakh live births in the year 2012.
4.66 Uttar Pradesh recorded the highest Crude Birth Rate (28.3 per thousand population) and Goa the lowest (13.2 per thousand population ). Kerala (14.8 per thousand population) among the bigger States and Goa (13.2 per thousand population) among the smaller states /UTs recorded the lowest CBR during 2010.The IMR varied very widely across the States. Kerala with an IMR of 13 is the best performing State among the bigger States in the country. The highest Child Mortality Rate was recorded in Madhya Pradesh (20 per thousand population) closely followed by Uttar Pradesh (19.6 per thousand population), Assam (17.9 per thousand population) and Odisha (17.1 per thousand population). Kerala with 2.9 CMR is the best performing State. Basic health indicators in Kerala and India during 2007 and 2012 is given below in Table 4.7
Table – 4.7
Basic Health Indicators in Kerala and India during 2007 &2012
Sl.No. |
Health Indicators |
Kerala | India | ||
| 2007 | 2012 | 2007 | 2012 | ||
1 |
Birth rate (‘000 population) |
15 |
14.8 |
23.8 |
22.1 |
2 |
Death rate (‘000 population) |
6.4 |
7 |
7.6 |
7.2 |
3 |
Infant mortality rate (‘000 population) |
14 |
13 |
58 |
47 |
| 4 | Child mortality rate 0-4 years (‘000 population) |
3 |
2 |
17 |
15 |
| 5 | Maternal mortality rate (per lakh live birth) |
110 |
81 |
300 |
212 |
| 6 | Total fertility rate (children per woman) |
1.7 |
1.7 |
2.9 |
2.6 |
| 7 | Couple protection rate (in percent) |
72.1 |
62.3 |
52 |
52 |
| 8 | Life at birth Male |
70.9 |
71.4 |
61.8 |
62.6 |
Female |
76 |
76.3 |
63.5 |
64.2 |
|
Total |
73.45 |
74 |
62.7 |
63 |
|
Source: Directorate of Health Services
4.67 Among the health indicators, the Child Mortality Rate in Kerala & India shows a declining trend. Death rate has slightly increased in Kerala during 2012 ie, from 6.4 in 2007 to 7 per thousand population. Spreading of communicable diseases &life style diseases are one of the major contributing factors for this. MMR has declined considerably from 110 per lakh live birth during 10th Plan to 81 during 11th Plan.
Health Indicators during Xth & XIth Plan -Target and Achievement
4.68 In India, Xth Plan aimed to reduce Maternal Mortality Ratio to 200 per lakh live births and Infant Mortality Rate to 45 per 1000 live births by 2007. But MMR &IMR had not achieved the target during 2007. MMR stood at 300 per lakh live births and IMR remains at 58 per 1000 live births during 2007 (Planning Commission). The major health target during Xth Plan in Kerala was the reduction of IMR from 14 per 1000 population to 8 per 1000 population by 2007. However as shown in Table 4.7, this was not achived. XIth Plan aimed to reduce Maternal Mortality Ratio to 1 per 1000 live births and Infant Mortality Rate to 28 per 1000 live births in India. Total Fertility Rate was targeted to be reduced to 2.1 Against this, MMR has fallen to 2.1 and IMR stood at 47 per 1000 live births. Total Fertility rate during 2012 is reported as 2.6 children per woman. Hence it is seen that XIth plan failed to achieve the health indicators totally in India. In Kerala, XIth Plan has achieved the target of reducing MMR to less than 100 per lakh live births. During 2012 MMR stood at 81 per lakh live births.
Health Sector Financing during XIth Plan
4.69 India ranks sixth from the bottom, amongst all countries in the world, in terms of public expenditure on healthcare as a proportion of the Gross Domestic Product. Health sector expenditure by the Centre and States, both Plan and Non Plan, has already increased from 0.94 percent of GDP in the Xth Plan to 1.04 per cent in the XIth Plan (Planning Commission XIIth Plan). In India out of the total allotment to Health sector during XIth Plan (र. 93981 crores), 95.3 per cent expenditure has been made.
Table – 4.8
Outlay and Expenditure of the Southern States during Eleventh Plan
(र. in lakh)
State |
Outlay |
Expenditure | Percentatge of Expenditure |
Kerala |
89915 |
91483.1 | 101.74 |
Tamil Nadu |
446614.9 |
511699.2 | 114.57 |
Andhra pradesh |
675267.86 |
635853 | 94.16 |
| Karnataka | 486769 | 468057.3 | 96.15 |
Source: India.stat.com
4.70 Among the Southern States, Tamil Nadu has achieved highest percent of expenditure compared to outlay followed by Kerala.
Major Schemes under Health Sector during XIth Plan
4.71 Kerala has successfully implemented various schemes under three systems of medicine such as Alopathy, Ayurveda and Homoeopathy for attaining better health indicators. Major schemes under Health sector during XIth Plan period are given in Table 4.9
Table – 4.9
Major Schemes under Health Sector during XIth Plan
Sl No. |
System/Scheme |
Outlay | Expenditure | Percentatge of Expenditure |
Allopathy |
||||
1 |
Infertility clinics in major hospitals |
30 | 29.33 | 97.77 |
2 |
Surveillance and control of Communicable diseases |
340 | 668.49 | 196.61 |
| 3 | Soceity for Medical assistance to poor | 565 | 1352.8 | 239.43 |
| 4 | Prevention of Non Communicable diseases | 2376 | 2321.6 | 97.71 |
| 5 | Medical care for victims of violence | 150 | 141.83 | 94.55 |
| 6 | Cancer care Programme | 70 | 67.46 | 96.37 |
| 7 | Strengthening of diagnostic facilities in DH/TH/CHC labs under DHS | 1173.50 | 1141.49 | 97.27 |
| Medical Education | ||||
| 8 | Malabar Cancer Centre | 2600 | 5135.78 | 197.53 |
| 9 | Medical University | 1500 | 2820.49 | 188.03 |
| 10 | Neonatology unit in Medical colleges | 400 | 381.31 | 95.33 |
| 11 | New Medical colleges in Idukki, Kasargodu,Pathanamthitta and Malappuram districts | 40 | 39.96 | 99.9 |
| 12 | Dialysis unit in Medical college hospitals, General hospitals and Taluk hospitals | 500 | 500 | 100 |
| 13 | Special support schemes for patients suffering from Cancer, heart and Kidney diseases | 500 | 500 | 100 |
| Ayurveda | ||||
| 14 | Ayurveda Mental hospital Kottakkal | 175 | 174.64 | 99.79 |
| 15 | Prakrithi Chikitsa hospital | 184 | 123.99 | 67.39 |
| Homoeopathy | ||||
| 16 | Seethalayam | 476 | 264 | 55.46 |
Source: Budget Accounts 2011- 2012
4.72 Infertility clinics were opened in major hospitals during XIth Plan. Cancer care programme is a new initiative during the last year of 11th Plan. The scheme aims to make all district hospitals in the State as model centre for cancer treatment and to equip one major Government hospital in the district where there is no facility for cancer treatment. It was envisaged to start new Medical colleges in Idukki, Kasargode, Pathanamthitta and Malappuram districts during the Plan period and the construction works are progressing. Homeopathic Women Health Care Centre (Seethalayam) is the first gender based scheme under Homoeopathy. Seethalayam provides aid to suffering women in the society. Now infertility clinic services and de-addiction treatment facilities are also available in the Seethalayam centres at Thiruvananthapuram, Kottayam and Kozhikkode districts.
Major Health Problems in Kerala
Communicable Diseases
4.73 Communicable diseases such as Dengue, AIDs, Malaria, Leptospirosis, Hepatitis, Chikungunya, HINI fever etc are increasing every year. Thiruvananthapuram district is almost endemic to Dengue and reporting about two thirds of cases in the State. Presence of co- morbidity is a major problem which leads to mortality in case of communicable diseases which affects liver.
Dengue Fever
4.74 Dengue was reported for the first time in Kerala in1997. Subsequently, it spread far and wide and now it has become endemic in certain areas especially in Thruvananthapuram district. India has recorded over 37,000 dengue cases, including 227 dengue deaths in 2012 (Health News December 4th 2012) . Among the Southern States of India, the highest percent of dengue deaths reported during 2011 is in Kerala (10 out of 1281) and Karnataka reported least percentage of dengue deaths (5 out of 405). During 2012 Kerala has reported the maximum of over 3033 dengue cases and 12 number of deaths up to September 2012. Details of Dengue cases and death reported in Kerala from 2007 onwards is given below.
Table – 4.10
Details of Dengue Fever Reported in Kerala
Year |
Cases |
Deaths |
Mortality (per cent) |
2007 |
677 |
11 |
1.62 |
2008 |
733 |
3 |
0.41 |
2009 |
1425 |
6 |
0.42 |
2010 |
2597 |
17 |
0.65 |
2011 |
1304 |
10 |
0.77 |
2012 |
3033 |
12 |
0.39 |
Source: Directorate of Health Services
4.75 Water supply mismanagement, gaps in public health infrastructure, increased mobility of population, and poor infrastructure in the State to monitor mosquito breeding were some of the reasons for the spread of communicable diseases. District wise patients treated and deaths reported due to Dengue Fever in Kerala during 2012 is given in Appendix 4.50
HIV/AIDS
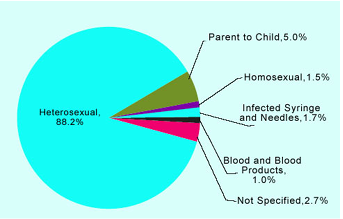
4.76 It is estimated that around 2.4 million people in India are currently living with HIV and come from diverse cultures and backgrounds. The vast majority of infections occurs through heterosexual sex (80 per cent), and is concentrated among high risk groups including sex workers, men who have sex with men, and injecting drug users as well as truck drivers and migrant workers.
Fig 4.4
Routes of Transmission of HIV, India, 2011-12
4.77 Among the Southern States, lowest percent of death due to AIDS cases reported during 2011 was in Kerala (0.85). As per the estimates of the Kerala State AIDS control society out of the 10846 AIDs cases reported, 1719 number of deaths were reported. During 2012,79 pregnant women were detected with HIV and 81 pregnant women underwent CD4 test during the year .The Kerala State AIDS Control Society implements various other programmes with the support of National AIDS Control Organization (NACO) supported by UNAIDS and WHO. The main programmes of the Society are Jyothis, Prathyasa, Pulari, Ushas, Blood safety, Suraksha, Community care centre, Tele counseling etc
Chikungunya
4.78 During 2006, Chikungunya emerged as a major ever known epidemic in India affecting 151 districts in 8 states of India including Kerala. In India, out of the total 18509 chikungunya cases reported during 2011, only 0.3 per cent were related to Kerala. The number has fallen to 49 during 2012 from 38 in 2011.
Table 4.11
Chikugunya Cases Reported in Southern States
States |
2007 | 2008 | 2009 | 2010 | 2011 |
Andhra Pradesh |
11 | 5 | 591 | 116 | 99 |
Karnataka |
18 | 46510 | 41230 | 8740 | 1941 |
Tamil Nadu |
20 | 46 | 5063 | 4319 | 3838 |
| Kerala | 0 | 24685 | 13349 | 1708 | 58 |
Source: India Stat.com
4.79 Among the Southern States, lowest number of Chikungunia cases were reported in Kerala. More vector control messures are requred for the eradication of vector borne diseases.
H1N1 Fever
4.80 In India 10.7 per cent of deaths were reported due to H1N1 fever during 2011. Details of cases of H1N1 Fever and deaths reported in Southern States of India during 2011 are given in Fig 4.5.
Fig 4.5
H1N1 Fever Cases and Deaths Reported in Southern States of India during 2011
4.81 During 2011, the highest number of H1N1cases were reported in Kerala State (out of the total number of 603). Among the Southern States in India, Karnataka reported highest per cent of deaths due to H1N1 fever (12 per cent ) followed by Kerala. Since Kerala has reported 5 per cent of death, more preventive measures are required.
Leptospirosis
4.82 This communicable disease is causing the highest number of deaths consistently for the last few years in the State. Although it showed a little decline during the last year, leptospirosis caused more than 100 deaths every year during the past few years. A broader analysis of the available statistics shows that the disease is mainly reported during the monsoon season especially among the young male adults of the labour class. Details of leptospirosis cases and deaths reported in Kerala are given in Fig 4.6.
Fig 4.6
Leptospirosis Cases and Death Reported in Kerala
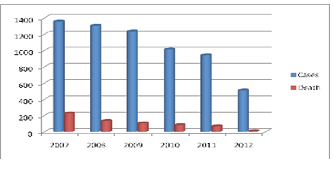
4.83 During 2007, out of the 1359 cases 17 per cent of cases resulted in death. The rate has come down to 7.4 during 2011 and to 2.2 in 2012.
Leprosy
4.84 The prevalence rate of leprosy in Kerala is 0.26 per 10,000 during 2012. There are three leprosy sanatoriums in Kerala with a bed strength of 1690. Incidence of new cases of leprosy in Kerala is given in Fig 4.7.
Fig. 4.7
New Cases of Leprosy in Kerala
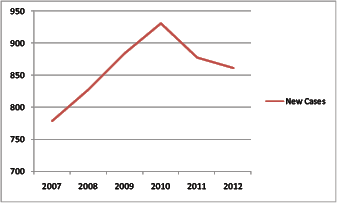
4.85 The incidence of new cases of leprosy is high during 2010 and thereafter it has declined. The National Leprosy Control Programme is effectively implementing eradication of Leprosy in the State.
Non Communicable Diseases(NCD)
4.86 Cardiovascular diseases, cancer, diabetes, chronic obstructive lung disease, mental disorders and Injuries are main causes of death and disability due to NCDs. Unless interventions are made to prevent and control NCDs, their burden is likely to increase substantially in future. Considering the high cost of medicines and longer duration of treatment NCDs, this constitutes a greater financial burden to low income groups.
Cancer
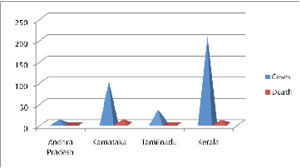
4.87 Cancer is the second biggest cause of death in India, growing at 11 per cent annually. With more than 10 million new cases every year, cancer has become one of the most devastating diseases worldwide”. Cancer cases and deaths reported in Southern States in India during 2011 is given in Fig 4.8.
Fig.4.8
Cancer Cases and Deaths in Southern States of India during 2011
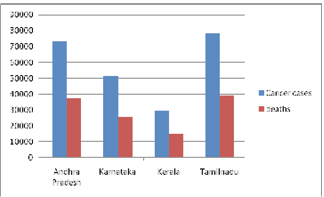
4.88 Among the Southern States Tamil Nadu reported highest per cent of Cancer deaths (7.3 per cent) followed by Andhra Pradesh (6.9 per cent) and Karnataka (4.7 per cent). The lowest per cent of death reported was in Kerala (2.8). As per the estimates of the Malabar Cancer Centre, total number of patients treated during 2012 is 47100. Out of this, 5.9 per cent are new cases. 699 major operations and 125 minor operations were conducted in the MCC during 2012. In the Regional Cancer Centre, 192810 cancer patients were treated during 2012. Of this,7.4 per cent are new cases.
Elderly Health
4.89 According to a White Paper on the Quality of Death, released by the Economist Intelligence Unit in 2010, the community model healthcare system from Kerala has been projected as a beacon of hope for providing palliative care services .With only 3 per cent of India’s population, the State provides two-thirds of India’s palliative care services. Kerala’s formal palliative care policy, the only state with such a policy is the community-based Neighborhood Network in Palliative Care (NNPC) Project that employs an army of volunteers with Government funding. There are all most 260 local community-based care units. India is a country with 2nd highest geriatric population.11 per cent of population comprises elderly which is projected to become 18 per cent by 2026. Care for the elderly would focus on promoting healthy lifestyles, encouraging care within families, integrating strengths of Indian Systems of Medicine with modern systems of medicine in rejuvenation therapies, and preferential attention in all public facilities.
Prevalence Rate of Other Public Health Diseases during 2007 & 2012
4.90 A comparative analysis of the Prevalence rate of public health diseases during 2007&2012 is given in Table 4.12.
Table 4.12
Prevalence Rate of Public Health Diseases during 2007 & 2012
Diseases |
Prevalence rate per 10000 population |
|
| 2007 | 2012 | |
Malaria |
0.06 |
0.19* |
Leprosy |
0.21 |
0.26 |
Tuberculosis |
0.40 |
0.52 |
| Diarrhoeal diseases | 14.14 |
19.76 |
| Pneumonia | 0.76 |
1.51 |
| Enteric fever | 0.19 |
0.25 |
| Measles | 0.08 |
0.06 |
| Respiratory infection | 233.88 |
305.12 |
| Chicken pox | 0.41 |
0.76 |
Source: Directorate of Health Services*2011 data
4.91 During the XIth Plan period, it is observed that leprosy, tuberculosis, diarrhoeal diseases, pneumonia, enteric fever, respiratory infection, and chicken pox have worsened
Mental Health
4.92 In Kerala, three Mental health centres are functioning with a bed strength of 1342. District Mental Health Programme is functioning in eight districts. There are only 22 psychiatrists and 13 clinical Psychologists under DHS. Rehabilitation facilities are offered through centres such as ASHA Bhavan for Men (Poojappura, Kozhikkode and Kochi) and ASHA Bhavan for Women (Poojappura, Thrissur and Kozhikkode). Lack of awareness, attitude of general public, neglect of family members, lack of proper follow up etc are the major problems of mental patients. Repeated and regular psycho education for parents, care givers and other family members, awareness creation of public through media, self employment to cured patients etc can create positive attitude towards the mental patients. Major problems in the mental health area are listed below
• Lack of a standardized form of care
• Lack of rehabilitation services
• Lack of proper regulatory mechanism and accreditation of rehabilitation services by voluntary organizations
• Lack of properly qualified and trained persons
• Lack of proper Guidelines for care of mentally ill patiants.
• Lack of properly designed epidemiological and evaluative research and absence of orientation of private sector initiatives
• Lack of integration of services of different mental health personnel such as Psychiatrists, Psychologists and Psychiatric Social worker
4.93 To overcome these issues in the Mental Health sector, a new Mental Health Policy is required.
Box 4.3
District Mental Health Programme Thiruvananthapuram
• The first DMHP clinic was established in 1999 in Thiruvananthapuram district
• The DMHP Thiruvananthapuram was selected as the most successful and model
programme in India by WHO
• The DMHP conducts clinics in PHCs, CHCs, Taluk hospitals, after care homes etc.
• The DMHP stated the first community based occupational therapy unit in Kerala at PHC
Mangalapuram on March 2012.
• Weekly psychiatric clinics are conducted in Government hospitals
• DMHP has about 2000 regular patients with 22 clinics and 8 after care homes
• As a part of School mental health project (Thaliru) 64 school counselors, 38 school
Junior Public Health Nurses were trained in school mental health issues and incorporated into
this programme
Source: Directorate of Health services
Prevalence of Alcoholism & Higher Suicide Rate
4.94 Kerala has the highest per capita consumption of alcohol in the nation- more than 1.76 gallons per person a year. Kerala accounts for the country’s highest consumption of alcohol followed by Maharashtra and Punjab. The increasing suicide rate is also an emerging issue in Kerala. There has been an increase in the rate of suicide from 24.6 per lakh population in 2010 to 25.3 per lakh population during 2011.
Shortage of Health Personnel
4.95 During the first year of XIth Plan there were 25225 medical and para medical personnel attached to the Directorate of Health Services whereas the number has increased to 32490 during 2012, showing 28 per cent of increase. But there is fall in the number of dentists (6 per cent ), nurses (10 per cent ) and paramedical staff (0.7 per cent ) under the Directorate of Health Services. The doctor- population ratio in Kerala, during 2007 was only 8244 whereas it has been increased to 108212 during 2012. District wise analysis shows that there exists considerable inter district variation. Doctor-population ratio varies from 1:6654 in Thiruvananthapuram district to 1:11388 in Malappuram district despite the fact that Malappuram has the highest proportion of medical institutions under the Directorate of Health Services.
4.96 In the Government medical colleges, there are 78 categories of specialty departments and in each department there are four categories of posts viz. Tutor/ Lecturer, Assistant Professor, Associate Professor and Professor. The total number of clinical/ non-clinical personnels in the Government medical colleges comes to 2347 during 2012 against that of 2183 in 2007.There are 1073 doctors under ISM department and 691 doctors in Homoeopathy during 2012. Since health problems are increasing, the availability of medical and para medical personnel has to be ensured properly.
Modern Medicine-Allopathy
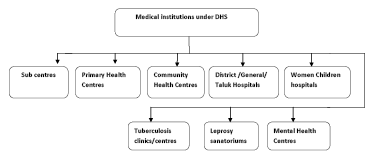
4.97 Out of the 1255 health care institutions under the Directorate of Health Services, 67percentage comprises Primary Health Centres (PHCs), 18 per cent comprises Community Health Centres (CHCs), 9 per cent comprises Taluk Head Quarter Hospitals/ District hospitals/ General hospitals, 2 per cent specialty hospitals and 4per cent are other hospitals. Category wise major medical institutions and beds in Kerala, details of IP, OP cases and Medical and Para medical personnel under DHS during 2012 are given as Appendix 4.51, 4.52 & 4.53.
Fig 4.9
Institutions Under Directorate of Health Service
4.98 A comparative analysis of the health care institutions under the Directorate of Health Services during the last year of 10th Plan and 11th Plan is given below.
Health Care Institutions under DHS
4.99 During the first year of XIth Plan there were 1274 health care institutions with a bed strength of 36642. During 2012 the number has fallen to 1255 and bed strength has increased to 37388. During XIth Plan period, 18 leprosy sanitariums and a TB centre was merged with General health system. Hence it is seen that there is a shortage of 19 institutions under the Directorate of Health services during the period. At the same time, there is considerable increase in the bed strength of the health care institutions. Due to the up gradation of PHCs into CHCs there is fall in number of PHCs during 2012. Similarly dispensaries were also upgraded into PHCs. At present private health care institutions are growing at a faster rate. These institutions possess huge infrastructural facilities but may not always have qualified health personnel. Therefore, the existing health care institutions has to be strengthened with adequate infrastructural facilities and medical and para medical personnel.
Para Medical Services
4.100 Medical and paramedical professionals are essential for better diagnostic facilities. The different type of laboratories functioning for the paramedical services in the State are given in Box 4.4
Box 4.4
Para Medical Services in Kerala
Public Health Laboratory |
The Public health laboratories cater to diagnostic needs of patients from both Government and private sectors |
Government Analyst Laboratory |
Check the quality of food materials and drinking water available to the public, the detection of newer type of adulterants such as pesticide residues, heavy metals, afflatoxins, histamine etc |
Food Safety Commissionerate |
Food Safety and Standards Authority of India has been established as a statutory body for laying down scientific standards for articles of food and to regulate manufacture, storage, distribution, sale and import of food so as to ensure availability of safe and wholesome food for human consumption. |
Chemical Examiner’s Laboratory |
It renders independent scientific service to Criminal Justice Administrative System including checking the adulteration of liquor samples during festivals, issuing certificates after examining material objects involved in criminal cases and also provides expert opinion to various courts |
Drugs Control Department |
Drugs control Department is involved in the work of licensing inspections, analysis of random samples of drugs and prosecution against offenders of law and other related acts implemented by the Department |
4.101 Details of technical work for the year 2012 in the Chemical Examiners laboratory is given in Appendix 4.54
Box 4.5
Adulteration Trend in Government Analyst Laboratory during 2012
The highest percentage of adulteration is found in PFA samples is in turmeric powder and the least adulteration is found in cereals and cereal products
Source: Government Analyst Laboratory, Thiruvananthapuram
Box 4.6
Major Achievements under Food Saftey Commissionerate during 2012
• Ban of Pan Masala and Gutkta
• Inspection of 1858 hotels and closure of 73 hotels due to food poisoning.
• Improvement notice issued to 696 hotels
• र 18,48,000 has been collected from hotels as compounding offences due to food
poison
• Permanent Food Testing Lab has been set up at Sabarimala with financial and
infrastructural support of Travancore Devaswam Board
• During 2012,12438 licenses were given to Food business operators and the
Department has collected र37314000 as licensing fee. 44230 number of registration
has been made and र 5044900 has been collected as registration fees.
Source: Food Commissionerate Office
National Rural Health Mission (NRHM)
4.102 Kerala has implemented the activities of National Rural Health Mission effectively for attaining the goals and objectives of National Population Policy and Millennium Development Goals. The mission aims to provide accessible, affordable and accountable quality health services to the poorest households in the remotest rural regions. Under NRHM, the focus is on a functional health system at all levels, from the village to the district. Although progress has been made towards achieving the goals of NRHM much more needs to be done in order to attain the Millennium Development Goals (MDGs).The provision of adequate human resources for health remains a challenge. Further, inequities based on rural–urban divides, gender imbalances and caste patterns are concerns that need eradication. The National Rural Health Mission will be converted into a National Health Mission (NHM) which would cover all villages and towns in the country (Planning Commission).
Kerala Emergency Medical Services (108 Ambulance) -New Initiative under DHS
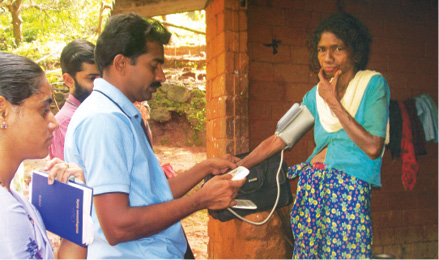
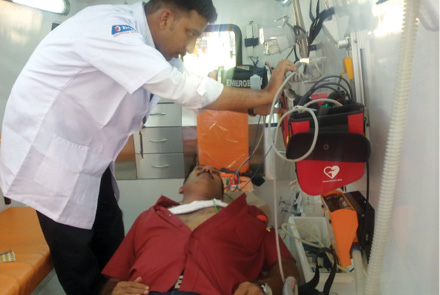
4.103 The Kerala Emergency Medical Services provides timely medical care services to road accident victims and other trauma victims. It is proposed to extend this programme to all districts by providing basic trauma care facilities in hospitals along the side of major roads, advanced trauma care facilities in all Medical colleges, timely services of ambulances etc. This Emergency Service can be availed by any person through a toll free number 108. The scheme has been implemented in Thiruvananthapuram and Alappuzha districts so far. Now it is proposed to implement the scheme in two more districts viz, Wayanad and Pathanamthitta. At present there are 43 number of ambulances functioning in these two districts and 66,119 number of medical emergencies have been attended to.
Medical education
4.104 In Kerala, medical education is imparted through five medical colleges at Thiruvananthapuram, Alappuzha, Kozhikode, Kottayam and Thrissur districts. Nursing Education is imparted through Nursing colleges in Thiruvananthapuram, Kozhikode, Kottayam, Alappuzha and Thrissur districts. Dental Colleges are functioning in Thiruvananthapuram, Kozhikode and Kottayam districts. Medical and Para medical courses conducted in Govt. Medical Colleges with annual intake of students and details of Clinical and non clinical personnel in Medical Colleges under DME, during 2012 is given in Appendix 5.57 &5.58. A comparative analysis of the status of medical college hospitals and attached institutions during the last year of Xth & XIth Plan period is given in Table 4.13.
Table 4.13
Status of Medical College Hospitals and Attached Institutions during 2007 & 2012
Medical College Hospitals |
Beds |
per cent of increase | Inpatients | per cent of increase | Outpatients | per cent of increase | Major Operations conducted | per cent of increase | ||||
2007 |
2012 |
2007 |
2012 |
2007 |
2012 |
2007 |
2012 |
|||||
| Thiruvananthapuram | 2415 |
3160 |
30.9 |
96700 |
170765 |
76.6 |
798000 |
1353060 |
70.0 |
38455 |
32575 |
-84.7 |
Alappuzha |
1031 |
1035 |
0.4 |
39394 |
50975 |
30 |
378540 |
710179 |
87.6 |
1163 |
3821 |
228.5 |
Kottayam |
1499 |
1604 |
7.00 |
53743 |
76898 |
43.1 |
654634 |
857648 |
31.0 |
8240 |
6571 |
-20.3 |
| Thrissur | 1107 |
1155 |
4.3 |
64367 |
61444 |
-4.5 |
346890 |
680123 |
96.0 |
2376 |
6275 |
164.1 |
| Kozhikkode | 2350 |
3325 |
0.06 |
114931 |
122820 |
6.9 |
580319 |
1734932 |
199.0 |
20062 |
15743 |
-21.5 |
| Total | 8402 |
10279 |
22.33 |
369135 |
482902 |
30.8 |
27558383 |
5335942 |
93.4 |
70296 |
64985 |
-7.6 |
Source: Directorate of Medical Education
4.105 There is considerable increase in bed strength (22 per cent), inpatients (30 per cent) and outpatients (93 per cent) in the medical institutions under DME during 2012. Major operations conducted in Alappuzha and Thrissur Medical colleges has been increased during the period. Similarly the delivery cases attended in Government medical colleges declined to 27 per cent. The mushrooming growth of private sector and lack of infrastructural facilities to meet the increasing health requirement of the public are the major contributing factors for this.
Kerala University of Health and Allied Sciences
4.106 The Kerala University of Health and Allied Sciences commenced its activities from 2010-11. This university is established for the purpose of ensuring proper and systematic instruction, training and research exclusively in all systems. The university has affiliated professional colleges which includes all systems of medicines such as Alopathy, Ayurveda, Homeopathy, Sidha, Unani, Yoga, Naturopathy, Nursing, Pharmaceutical science and paramedical courses. The University conducted 69 courses since inception and declared results of 40 examinations. Now the University is facing acute shortage of manpower. Out of the 19693 students who attended examination 50.3 per cent passed (9897) during 2011-12.
Box 4.7
Major Achievements of Health University
• Affiliation of 239 colleges including 50 new colleges and 189 transferred colleges from
universities has been completed
• Online transmission of question papers, entry of internal marks, including practical
marks and online publication of results
• Examination held under CCTV surveillance
• 24 Under graduate examinations were conducted in which 18451 candidates appeared
and 9097 passed with an aggregate pass percentage of 50
• 86 post graduate examinations were conducted in which 1242 candidates appeared and
800 passed with an aggregate pass percentage of 65
Source: Kerala University of Health and Allied Sciences
Indian System of Medicine
4.107 Ayurveda is a science dealing not only with treatment of some diseases but also a complete way of life. Indian System of Medicine department renders medical aid to the people through the network of Ayurveda hospitals and dispensaries, grant-in-aid Ayurveda institutions, Sidha- Vaidya, Unani, Visha , Netra and Naturopathy. Special hospitals such as Mental Hospital, Panchakarma, Nature cure and Marma are functioning under this department. At present there are 119 hospitals and 768 dispensaries under ISM department. The State Medicinal Plants Board also co-ordinate matters relating to the cultivation, conservation, research and development and promotion of medicinal plants in the State. List of major institutions and district wise distribution of institutions, beds and patients under ISM department during 2012 is given in Appendix 5.59 and 5.60.
Box 4.8
Global Ayurveda Fest 2012
Global Ayurveda Festival (GAP) was held on February 2012 at Thiruvananthapuram as a joint venture of Centre for Innovation in Science and Social action (CISSA) department of AYUSH. Following are the major recommendations:
• The State of Kerala should be declared as Ayurveda State of India
• High priority in Government intervention should be given to health education based on Ayurveda principles and preventive health practices
• An international Trans-disciplinary advanced research centre should be established
• A 10 fold increase in industry turn over should be targeted in the next five years through innovative, long term support to the sector by various Agencies of the Government alongside incentives like tax holidays and concessions
• State and Central Governments should support centres of Excellence in clinical practice in various specialities of Ayurveda with interdisciplinary perspective
• Ayurveda biology should be included in school carriculam
• India should take the lead to chalk out a joint action programme with the SAARC countries for promoting Ayurveda and tapping the potential of global markets
• A certification agency for authentic Kerala Ayurvedic products and services should be set up by the State Government
• A global network should be established to promote authentic Ayurveda products and services by involving an appropriate agency
• Medicinal plant cultivation should be promoted in the co-operative segment and in the small scale land holdings, with buy back guarantee of products. Farmers should given subsidy, grants and soft loans on a long term basis
• A contemporary model of Ayurveda gurukula should be attempted on pilot basis at selected places where adequate initiatives and competency are available
Source: Kerala Calling April 2012
Balamukulam-School Health Programme-New Initiative under ISM
4.108 The School Health Programme which is named as Balamukulam was started in three districts viz, Palakkad, Wayanad & Kasargode during 2012-13. Under this scheme, 5766 number of students received counseling, treatment, medicine etc. Now as a part of the sheme, it is proposed to implement schemes such as Prasadam, Ritu and Kaumarasthoulyam in Kollam,Thrissur and Kozhikkode districts which are intended to manage iron deficiency anemia in school going children, health problems of adolescent girls and correcting menstrual disorders and obesity in school children.
Ayurveda Medicine Manufacturing- OUSHADI
4.109 OUSHADI is the largest manufacturer of Ayurvedic medicines all over India in Government sector functioning especially as a profit making public sector undertaking. Oushadhi is the exclusive supplier of Ayurvedic medicine to 1016 Government hospitals and dispensaries of ISM department. In Kerala Oushadhi supplies र 18-20 crores of medicines each year to State ISM department at 40per cent less than market price and ISM department supplies this medicine to the poor patients in the State free of cost. The company also caters to the demand of the public through a network of 468 exclusive agencies spread all over the State. Total sales has shown 85per cent increase during 2012 when compared to the sales during the year 2007-08. Similarly profit after tax shows 271.6per cent of increase during the same period. Similarly the dividend paid to State Government also shows an increasing trend. The details of turnover for the period from 2007-08 to 2011-12 are given below in Appendix 4.61.
Ayurveda Medical Colleges
4.110 There are 3 Government Ayurveda Medical Colleges situated at Thiruvananthapuram, Thrippunithura and Kannur districts having a bed strength of 1259. Panchakarma hospital and Women &Children hospital are also functioning under the Government Ayurveda Medical college Thiruvananthapuram. There are two aided colleges, 11 self financing colleges and a self financing siddha college for imparting Ayurveda medical education. Annual intake of students and courses in Ayurveda Medical colleges are given in Appendix 4.62. Details of Beds and patients in Ayurveda Medical colleges during the last year of Xth Plan & XIth Plan is given in Table 4.14.
Table 4.14
Beds and Patients treated in Ayurveda Medical Colleges during 2007 & 2012
| Sl No. | Medical College Hospital |
Beds | In patient | Outpatient |
|||
2007 |
2012 |
2007 |
2012 |
2007 |
2012 |
||
| 1 | Government Ayurveda College Thiruvananthapuram |
638 |
620 |
6373 |
22410 |
103858 |
149247 |
| 2 | Government Ayurveda College Thrippunithara |
205 |
489 |
1103 |
2701 |
308425 |
189070 |
| 3 | Government Ayurveda College Kannur |
150 |
150 |
830 |
1328 |
14903 |
65665 |
| Total | 943 |
1259 |
8306 |
26439 |
427186 |
403982 |
|
Source: Directorate of Ayurveda Medical College
4.111 The above analysis shows that there is considerable increase in the bed strength (34 per cent) and inpatients (218.3 per cent) under the Government Ayurveda medical colleges.
HOMOEOPATHY
4.112 There are 581 homeopathic dispensaries and 30 hospitals with a total bed strength of 945 under Homoeopathy department in the State. In addition, Kerala State Homoeopathic Co-operative pharmacy (HOMCO) Alappuzha, a medicine manufacturing unit is also functioning under the Directorate of Homeopathy. During 2006, there were 31 hospitals and 525 dispensaries with a bed strength of 970. As Pathanamthitta homoeo hospital is functioning in a remote area there are no inpatients in the hospital and therefore the hospital is now functioning as a dispensary. District wise distribution of institutions, beds and patients treated under Homoeopathic department during 2011 &2012 is given as Appendix 5.63. Homoeo Medical Education is imparted through two Govt. Homoeopathic Medical Colleges, at Thiruvananthapuram and Kozhikode. Annual intake of students and courses in Homoeo Medical Colleges are given in Appendix 4.64.
Box 4.9
Major Achievements under Homoeopathy during 2012
• 30 new homoeo dispensaries started
• 14 dispensaries were upgraded as model dispensaries
• Up gradated one homoeo dispensary into a 10 bedded hospital
• 15 temporary dispensaries opened during festival seasons
• 717 medical camps and 283 health awareness camps were conducted and preventive medicine were distributed to 76718 patients
• Regional communicable diseases prevention programme was implemented in 5 wards of Kainakari panchayath in Alappuzh adistrict
• School health programme conducted in 28 selected schools
• De-addiction centres and infertility clinics started in the Seethalayam centres at Thiruvananthapuram,kottayam and Kozhikkode
• Speciality clinics started for endocrine disorders in Idukki, mother and child centre in Kannur, geriatric centre in Alappuzha, speciality mobile clinic in endosulphan affected area in Kasargod
Source: Directorate of Homoeopathy
Ayush Holistic Centre for Prevention and Management of Life style Diseases New initiative under Homoeopathy
4.113 The scheme provides prevention and management of life style diseases by integrating different ayush systems by integrating the merits of homoeopathy, ayurveda, naturopathy and yoga. The Homoeopathy department started AYUSH centres for prevention and management of life style diseases at Thiruvananthapuram and Kozhikkode districts during 2012.
Medical Institutions in the Public and Private sector- a Comparison
4.114 Kerala’s health care system consists of a mix of public and private sector providers of health services. Due to lack of infrastructure facilities in the public sector, people often goes to the private sector. The private institutions lack qualified medical and para- medical personnels. A comparative analysis of the medical institutions under Public sector and private sector in Kerala during 2012 are given in Table 4.15.
Table 4.15
Major Medical Colleges in Health Sector in Kerala 2012
(No.)
Sl.No. |
Institutions |
Govt sector |
Private sector |
| 1 | Medical College | 5 | 17 |
| 2 | Dental College | 3 | 19 |
| 3 | Nursing College | 5 | 106 |
| 4 | Ayurveda Medical colleges | 3 | 14 |
| 5 | Homoeo Medical colleges | 2 | 3 |
| 6 | Siddha | 1 | 1 |
| Total | 19 | 160 |
Source: Kerala University of Health Sciences, Thrissur, DHS, DME
4.115 Out of the total Medical colleges functioning in the State 77 per cent are under private sector whereas only 23 per cent are functioning under Government sector. Similarly 86 per cent of Dental colleges and 95 per cent of Nursing colleges are functioning in the private sector. There is a tremendous increase in the number private Nursing colleges.
Immunization Coverage
4.116 Immunization is one of the most successful and cost-effective health interventions and prevents debilitating illness, disability and death from vaccine-preventable diseases such as diphtheria, hepatitis A and B, measles, mumps, pneumococcal disease, polio, rotavirus diarrhoea, tetanus and yellow fever. Starting on 21 April 2012, WHO is uniting countries across the globe for a week of vaccination campaigns, public education and information sharing under the umbrella of World Immunization Week.
Table 4.16
Target and Achievement of Immunization during 2011
State |
Target |
Achievement |
Per cent |
Andra Pradesh |
1480000 |
500003 |
33.78 |
Karnataka |
1149000 |
84904 |
73.71 |
Tamil Nadu |
1147000 |
756171 |
65.93 |
Kerala |
486000 |
458860 | 98.05 |
Source: India Stat.com& Directorate of Health Services
4.117 Kerala has achieved 98 per cent of target in Immunization during 2011. During 2012, the coverage of BCG was 211362. The coverage of immunization programmes in Kerala during 2011-12 is given in Appendix 5.65
Need for a National Health Policy
4.118 The Central Government is now trying to redraft the National Health Policy. Though the country has implemented various programmes in health sector the goal of health coverage to all has not been achieved. At the same time new challenges are emerging. It is necessary to provide medical care to all through standardized health care institutions. Health sector is now facing crucial shortage of qualified medical and para medical personnel. Similarly, treatment through newer technologies should reach the grass root level. The cost of medicines are increasing and the National Health Policy should ensure the availability of free medicines to the poor patients and availability of affordable medicines. Special attention to the needs of marginalised sections of the population is also necessary.
4.119 To improve the prevailing situation, the problem of rural health is to be addressed both at macro and micro levels. This is to be done in a holistic way, with a genuine effort to bring good health to the poorest of the population. Kerala has to recapture the basic structure and policies that helped reduce mortality in the past and to develop the capacity to deal with the problems associated with non-communicable diseases which now affect all segments of the population. The control and management of NCDs should adopt a holistic approach leading from preventive action for the healthy, screening for the high risk population, primary care for the affected, tertiary care for acute cases and palliative care for the terminally ill patients. Shortage of human resources is a distressing feature of Kerala’s healthcare services.
4.120 Geriatric and palliative care should be integrated into routine health care. Promotion of Mental Health among adolescents and addressing mental health needs of the aged are also priority areas. Kerala faces the paradoxical situation of more doctors passing out every year and lesser number being available to work in the public sector. Systems have to be devised to ensure that persons educated through public resources are available to serve the public should the need arise. Kerala has to focus on developing and improving systems to ensure good governance of the health system.
4.121 Twelfth Plan will aim to improve the coverage of public health institutions to reach hitherto uncovered regions and segments of population. Second generation and special problems in the health sector will be addressed by specially and separately designed new programmes. Vulnerable sections and problem areas will be given due importance. The departments in the Health sector will improve the quality of services with properly defined components for development of infrastructure, manpower and other aspects. The Twelfth Plan will put in place a comprehensive regulatory and governance mechanism to ensure quality standards.
SECTION 4
Social Security and Welfare
4.122 Social security provides an assurance for physical, mental, social and economic health of the society. In Kerala, the Social Justice Department is the nodal agency involved in addressing the problems of social security and welfare. The departments and agencies stands for social security measures and their major activities are given in Appendix 4.70
Trends in Outlay and Expenditure
4.123 The proportion of the outlay of social security and welfare sector including child development to State plan during 2007-08, the first year of the eleventh five year plan was nearly 1 percent which doubled in 2011-12, reflecting the higher priority given to this sector. However the consistent increase in outlay has not been maintained in spending. The expenditure on the sector in proportion to total State Plan Expenditure declined from 2per cent in 2007-08 to 1per cent in 2008-09 & 2010-11 which improved to 2per cent in 2011-12.
4.124 The social security programmes in Kerala can be grouped into two:- A. Institutional Care and B. Social Assistance Programmes.
A. Institutional Care
4.125 In the state, Government as well as Voluntary Organizations provides institutional care and protection to the weaker sections. The number of welfare institutions in Government sector was 50 in 2007, which increased to 56 in 2011.
Fig 4.10
Sanctioned Strength and Inmates of Welfare Institutions (In numbers)
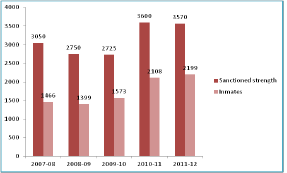
Source: Economic Review 2007 to 2010 & Social Justice Department
4.126 The number of inmates is less compared to the sanctioned strength among all categories of institutions during this period. This reveals the ineffectiveness and failure of the existing delivery system of the institutions. For example, though the district of Kasaragod has a large number of Endosulphan victims, it does not have any institutions for the physically challenged persons. This necessitates an integrated policy framework, careful planning for establishing and managing the institutions and thorough revamping to attain desired results. Major welfare institutions run by SJD and the services offered by them are given in Appendix 4.71 The district wise details are given in Appendix 4.72
B. Social Assistance Programmes
4.127 Social assitance programmes aims to reduce poverty and vulnerability among the people having little or no regular means of subsistence. Various social assitance programmes are listed below.
Social Security Pension Schemes through LSGs
4.128 Agriculture labour pension, Indria Gandhi National Old Age pension, pension for disabled, pension for unmarried women above 50 years of old and widow pension are the major schemes. In 2011, the total no. of pensioners except ALP was about 14 lakh which is double the number in 2007. The highest category is of widow pensioners. Among the districts, Thiruvananthapuram is top with highest number of beneficiaries and Idukki the least. The district wise coverage is given in Appendix 4.73
Unemployment Assistance
4.129 For social security of the registered unemployed, Government provides unemployment wages through the LSGs. During 2011, about र 26 crore has been disbursed to 303691 beneficiaries. The district wise coverage is given in Appendix 4.74
Social Security and Welfare to Unorganized Sectors
4.130 Social security coverage to workers in the unorganized sectors is given through the Welfare Fund Boards(WFBs). Of the 28 welfare fund boards in 201, twelve are under the direct control of the Labour department. In 2011, the total members enrolled in these boards were about 60 lakh, of which 47per cent from agriculture sector including fisheries and dairy. Now the boards are functioning under different departments and the rate of assistance varies. To bring all these boards under one umbrella is very helpful for monitoring and bringing uniformity. Details of workers enrolled in the WFBs are shown in Appendix 4.75
Welfare of Aged People
4.131 The increase of ageing population is a complex phenomenon. As per 2001census, Kerala has the highest proportion (10.5per cent) of the elderly in the country. Population projections predict that the proportion of elderly population in the state is likely to increase 40 percent in 2061.
Table 4.17
Demographic Profile of Elderly 2001-2061
Year |
No. of aged (millions) | Percentage Total |
Growth rate (per cent) | ||||||
| 60+ | 70+ | 80+ | 60+ | 70+ | 80+ | 60+ | 70+ | 80+ | |
| 2001 (Census) | 3.33 | 1.4 | 0.39 | 10.5 | 4.4 |
1.2 | 2.94 | 3.99 | 3.45 |
| 2011 | 4.20 | 1.94 | 0.54 | 12.2 | 5.6 |
1.6 | 2.61 | 3.86 | 3.85 |
| 2021 | 5.75 | 2.46 | 0.76 | 16 | 6.8 |
2.1 | 3.69 | 2.68 | 4.07 |
| 2031 | 7.78 | 3.52 | 1.01 | 21.3 | 9.7 | 2.7 | 3.53 | 4.31 | 3.29 |
| 2041 | 9.88 | 4.86 | 1.48 | 27.8 | 13.7 | 4.2 | 2.7 | 3.81 | 4.65 |
| 2051 | 11.48 | 6.22 | 2.11 | 34.4 | 18.6 | 6.3 | 1.62 |
2.8 | 4.26 |
| 2061 | 11.95 | 7.18 | 2.76 | 39.6 | 23.8 | 9.1 | 0.41 | 1.54 | 3.08 |
Source: Kerala State Development Report, Planning Commission of India
4.132 Among the elderly population the women outnumbered the men and majority of them are widows. Also Kerala is the second largest state with highest proportion (1.2 per cent) of people above the age of 80 and this is likely to increase 9 percent in 2061.
Institutional Services to Aged People
4.133 During 2011, there were 11 Old Age homes with 566 inmates against the sanctioned strength of 1025. Also there were about 5000 inmates in 82 registered Old Age homes and 5 foundling homes run by NGOs. In addition a number of private paid Old Age homes are functioning in the state. More effective licensing, regulation and monitoring to scrutinize these homes at the Government level is required to ensure better facilities including pain and palliative care units in these homes.
Old Age Pension Scheme
4.134 It is a monthly pension scheme shared by both State and Centre for BPL persons aged 60 years or above. During the reporting period the scheme benefited close to 3 lakh older persons. The maximum coverage is from Trivandrum district and the least from Pathanamthitta. District wise coverage in 2011 is given in Appendix 4.73
Vayomithram
4.135 Vayomithram, first of its kind in India launched by Kerala Social Security Mission in 2011 is intended to give welfare services such as free medicine, palliative home care, help desk facilities to persons above 65 years. During 2011-12, the programme assisted 62588 persons.
4.136 An ageing population has become a major challenge to the state and society. The CDS study in 2010 reveals that 73 percent elderly are depending on their family members. Further, as per an estimation of Alzheimer’s Decease International, there are nearly 1.5 lakh Alzheimer’s patients in the state. The State Policy on older persons drafted in 2003 recognizes the well-being of the elderly as a responsibility of the State is still pending implementation. Identification of more eligible NGOs and other support agencies under IPOP scheme of GOI are necessary for getting financial assistance from centre as only two agencies in the State were supported in 2010.
Persons with Disabilities
4.137 As per 2001 census, nearly 3per cent of the total population in Kerala has at least one disability. The SPAC report in 2004 observed that approximately 5 lakh children have one form of disability or the other. It is estimated that the incidence of learning disability in children is about 12per cent to14per cent.
Institutional Services to Persons with Disabilities
4.138 In 2011, there were 18 institutions for the care and protection of physically and mentally challenged persons with 616 inmates against a sanctioned strength of 725. Under Education Department there were 4 special schools for visually impaired children and 3 for hearing impaired children. Even though 277 private institutions in the state giving some sort of education in the area, only 55 schools received grant- in-aid from GOI, under DDRS, a scheme for vocational training to mentally challenged. Though there are about 12 private institutions attempting specific rehabilitation for children with Cerebral Palsy, Autism and Down Syndrome, there is no such institution in Govt. sector.
Disability Pension Schemes
4.139 This scheme includes two pension schemes viz. pension for mentally challenged and pension for physically challenged. In 2011, the schemes benefited about 3 lakh persons. District wise coverage of pensioners is given in Appendix 4.73
Issuing Disability Certificate-cum- Identity Cards
4.140 According to the Persons with Disability Act, 1995 it is mandatory to provide disability certificate to all disabled. In view of this, Government has started this scheme in 2009-10. From 2010 to 2011, the department issued 251273 identity cards. Though the programme envisaged issuing ID cards to the entire disabled population by the end of 2011-12, the desired target has not been achieved.
Box 4.10
Composite Regional Centres (CRCs)
CRCs are a part of overall strategy to reach out to the disabled people for awareness generation, training of rehabilitation professionals, service delivery and so on. At present there are 7 CRCs functioning in India. In Kerala, one such institution has been set up at Kozhikode on 17th February 2012.
State Commissionerate for Persons with Disabilities
4.141 The State Commissionerate was set up under the Act of Persons with Disabilities Act, 1995 to monitor whether the rules stipulated in the above Act is implemented properly. The other functions of the Commissionerate are conducting awareness camps, redressal of the complaints of disabled persons, inspection of institutions for disabled, etc.
National Institute of Speech and Hearing (NISH)
4.142 NISH was established in 1997 for the rehabilitation and welfare of the deaf and hard of hearing persons in the state with facilities for detection, evaluation of hearing loss and rehabilitation. The activities conducted in the area of disabilities are pre- school programmes and parent guidance programmes, audiology evaluations and speech evaluations, speech therapy, physiotherapy, psychology services and medical services, ear mould fabrication and academic programmes.
Box 4.11
State Initiatives in the Area of Disabilities
As per the recommendation of the Working Group on Disability for the formulation of XIIth Plan, Government has launched a special programme for prevention, detection and early intervention of disabilities and for education, employment and rehabilitation of disabled. The major activities visualized under the programme are implementation of Rubella Vaccination to adolescent girls, setting up of Early Detection Centres and establishing Pre-schools for handling multiple disabilities in each district for deaf and hard of hearing children, visually challenged children, mentally retarded children, children with Autism and children with Cerebral Palsy. As a part of this, the National Institute for Speech and Hearing (NISH) will be developed into a University for Disability Research and Education. Government has appointed an empowered committee for the smooth implementation of the programme. Expert Committees were also appointed on each area, viz, prevention of disabilities, early screening and early detection of disability, early intervention and for the upgradation of NISH as a university.
Kerala State Handicapped Persons Welfare Corporation
4.143 It is a State Undertaking set up for promoting and implementing welfare schemes for disabled persons. Distribution of aids and appliances, self- employment scheme (bank loan subsidy), financial assistance to self- help groups, vocational training to SC/ST disabled persons, etc. are the major activities of the corporation. Further, it is the nodal agency for the implementation of the NPRPD scheme of Government of India being implemented in Kasaragod, Palakkad and Kollam districts. In 2011-12, the corporation assisted 2338 disabled persons through various schemes.
4.144 There is a need to bring in programmes focusing (i) Prevention, Detection and Early Intervention of disabilities (ii) Requirement of persons with disabilities for Cerebral Palsy, Autism and Mentally Retarded (iii) Strengthening the machinery attending to the rehabilitation, development and empowerment of persons with disabilities (iv) Preparation of comprehensive database and online State depository of resources on disabilities (v) Training of care-givers (vi) Formation of a State Mission for disabled (vii) Extending DCRCs for early detection of disabilities in unserved districts.
Welfare of Ex-Servicemen & War Widows
4.145 As on 30th March 2012, there were 163072 ex-service men and 243 war widows. Rehabilitation training on vocational / professional / technical courses for equipping the ex-service men/war widows is a major programme. 291, ex-service men were provided rehabilitation training in 2011-12, of which 138 were widows and dependents.
Welfare of Prisoners
4.146 In Kerala, the jail infrastructure consists of 52 different types of jails. As on March 2012, there were 6538 prisoners, of which 183 are women. The number of prisoners reduced to 3per cent when compared to the figures in 2007. The women prisoners in Kerala are marginal (3per cent) compared to other southern states where this proportion ranged from 4 to 6 percent. Overcrowding in jails is the major problem as it is very difficult to accommodate further prisoners. Modernization of Prison and Welfare of Prisoners are the two major schemes implemented by the Prison department. During 2011-12, the department utilized the entire budget provision. Details of prisoners in jails is given in Appendix 4.76
Box 4.12
Major Initiatives of Prison Department
Solar Energy System and Energy Saving Measures in Jails: - The Jail Department plans to install solar power project in all 52 jails in Kerala under XIIIth Finance Commission Award. It would save an amount of र.40 lakh in every year by using solar cooking facilities instead of LPG cylinders. The project has been commissioned on 3rd October, 2012 at Central prison, Thiruvananthapuram on a pilot basis.
Commercial Production of Chapatti and Chicken Curry:- As a new initiative, the Department launched sales outlet of Chapatti and Chicken curry in three Central prisons, Thiruvananthapuram, Viyyur and Kannur and in District jail, Kozhikkode. Chapatti and chicken curry is being sold at a nominal price. About र.4 Crore has been achieved through this project. Since the project is a great success, it has been extended to the public through mobile sales units and sales outlets in various locations.
Open Prison, Nettukaltheri:- This open prison, the first its kind in the nation, is a prison without a compound wall. The main objective of the prison is to rehabilitate the inmates by changing their attitudes and to ensure that they have a good social life after release. There are 360 inmates in 2012 and each inmate earns nearly र.117 per day from various agricultural activities. A check dam with a capacity of 4 crore litres and a reservoir with a capacity of 1 lakh litre has been constructed for the irrigation of 60 acres of land. During 2012, an amount of र.1.62 crore was earned by the department from these activities of prisoners.
Welfare of Women
4.147 There were 22 different institutions for the care and protection of widows, mentally cured women, women under immoral traffic, etc. As against the sanctioned strength of 950, the inmates in 2011 were 612. Though there are needy women who require secure shelter, revamping of the institutions as per the provisions visualized in State Old Age Policy and Women Policy need improvement measures for effective service delivery.
Pension Scheme for Women
4.148 Widow pension scheme and pension for unmarried women above 50 years are the major schemes. During 2011, nearly 8 lakh women were assisted which is 148per cent of the beneficiaries of 2007. Among the beneficiaries, nearly 60 per cent are widow pensioners. The highest number of beneficiaries is from Thiruvananthapuram district and least from Idukki. District wise coverage of beneficiaries is given in Appendix 4.73
Skill Development Programmes
4.149 The flagship progamme on finishing school started during the eleventh plan focused to improve the skill development activities for vocation of women. Kerala State Women Development Corporation is the main agency imparting skill development activities. The Corporation established two REACH institutions to impart training programmes for women. Providing proper placement to the trainers after completion of the training is a matter of grave concern
Rajiv Gandhi Scheme for Empowerment of Adolescent Girls
4.150 The central scheme launched in Kollam, Idukki, Malappuram and Palakkad districts aims at empowering the nutritional and health status and upgrading various skills of adolescent girls by using the platform of ICDS. During 2011 the scheme assisted around 3 lakh beneficiaries which is an increase of 19 per cent compared to 2010. The scheme requires strengthening of the linkage with education and skill development.
Indira Gandhi Matritva Sahyog Yojana
4.151 IGMSY is a centrally sponsored scheme to improve the health and nutrition status of pregnant, lactating women and infants by promoting appropriate practices, care and service utilization during pregnancy, safe delivery and lactation. The scheme assisted 25477 beneficiaries in 2011 which shows a percentage decline of 31per cent compared to 2010.
Psycho-social Service to Adolescent girls
4.152 Under the scheme adolescent health clinics were established in selected schools for solving the psycho-social problems of the adolescent girls with the support of concerned PTAs and LSGs. A qualified counselor is engaged in the school for providing counseling and guidance to the adolescent girls. The health clinics started in 251 selected schools in the year 2008 have been extended to 500 schools in 2011-12.
Snehasparsham
4.153 The programme aims to address the problem of unwed mothers particularly ST communities in Wayanad district. Monthly assistance of र.1000 is given to all unwed mothers of SC/ST families and to other communities of BPL families and the scheme benefited 581 women in 2011-12.
Kerala Women’s Commission
4.154 For the empowerment of women, the commission has been conducting gender concentization seminars, adalaths, district level Jagratha Samithies, petition/redressal etc. During 2011-12, the commission received 21327 complaints of which Thiruvananthapuram is on top and Wayanad is the least. The nature of complaints shows that harassment of women is on the increse. There is three times increase in no. of complaints received in 2011 compared to 2007. The category wise and district wise details of complaints received as on 31-03-2012 are given in Appendix 4.77
Kerala State Women’s Development Corporation
4.155 Self employment schemes for women, flagship programme on gender awareness and construction of She- toilets are the major programs of the corporation. During 2011-12 the corporation benefitted 1630 women in self employment through National Corporations and constructed 11 automatic and unmanned cost effective and environment friendly She-toilets. As part of micro finance the corporation has distributed र.1 crore to 39 selected SHGs. Under gender awareness programmes, 800 adolescent’s girls were trained in self defence and 288 students were given ICT awareness.
4.156 Addressing violence against women is a major challenge to the state. Establishing fast- track courts for early disposal of cases against women, establishing more women police stations, strengthening of women help lime services, Jagratha Samathis and Vigilance committees at local level are to be initiated for protection of women. For increasing work participation rate of women, convergence of various programmes such as Ajeevika, MGNREGA and other skill development initiative of Ministry of Labour and Employment is a major tool.
Welfare of Children
4.157 Kerala has achieved marked improvement in child empowerment particularly in the area of immunization, pre-school education, elimination of polio, reducing infant mortality etc. Some important health and nutritional indicators of children in Kerala are summarized in Table 4.18
Table 4.18
Health and Nutritional Indicators of Children in Kerala
| Current Status | Target for XII Plan |
Target for Millennium Development Goal (2015) | ||||||
| IMR | MMR | Anemia | IMR | MMR | Anemia | IMR | MMR | |
| Kerala | 13 | 81 | 32.80 | 6 | 37 |
16 | ||
| India | 47 | 212 | 55.30 | 25 | 100 |
28 | 27 | 109 |
Source: Planning commission of India & Directorate of Health Services
4.158 According to 2011 census, 9 per cent of Kerala’s population constitutes children below the age of 6 years. The State Plan of Action for the Child in Kerala 2004, adopted wider perspective measures for the holistic development of the children. However some social as well as health issues are still exist which needs priority attention.
4.159 As per census 2011, Kerala’s child sex ratio (0 to 6years) has come down in the last decade. While the overall sex ratio in Kerala improved from 1058 in 2001 to 1084 in 2011, the child sex ratio decreased from 963 in 2001 to 959 in 2011 particularly in central Kerala where it is below the state average. This clearly highlights the need for a comprehensive strategy for care and protection of the girl child. As per NFHS II & III surveys, wasting and underweight among children in Kerala has been increased from 11 to16per cent and 27 to 29per cent respectively.
4.160 As per the report published by the National Crime Records Bureau, the crime against children in the state has increased by 164 per cent from 2008 to 2011. Of the total no. of crimes Kerala’s share was nearly 5per cent while that of Karnataka 4per cent and Tamil Nadu 3per cent. There is an increase in kidnapping and abduction, rape and murder. More over about 12per cent of children and adolescents are at high risk of developing mental disorders including alcohol and drug abuse. Also the children of the poor in urban areas face multiple instances of deprivation, violence and exploitation including sexual abuse.
Institutional Services to Children
4.161 During 2011, there were 38 different institutions for the care and protection of children. 419 registered orphanages and 3 beggar homes are functioning in the state managed by NGOs and Voluntary organizations with the support of Govt benefitting about 44000 children.
Box 4.13
Kerala Social Security Mission
The Mission was established in 2008 under the Department of Social Justice, the first organization in the country for providing social security to the weaker sections. During 2011-12, the mission focused on the needs of children.
Cancer Suraksha for Child Patients : The scheme intends to give free treatment to child patients
below the age of eighteen through Government approved hospitals and the scheme assisted 2693 child patients, till date.
Thalolam: The Scheme aims to provide free treatment to children below the age of 18 years who are suffering from life threatening diseases. Till date, the programme covered 4931 patients.
Cochlear Implantation: The objective of the project is to provide cochlear implant to children selected by Regional and State level Technical Committees for cochlear implantation. During 2011-12, the programme benefitted 50 children.
Juvenile Justice Services
4.162 Juvenile justice endeavors to undertake steps for all round development and rehabilitation of children such as orphans, destitute, neglected, street children, victims of violence etc. Now, there are 9 Juvenile Homes, 14 Observation Homes and one Balasadanam (certified as juvenile home) with a capacity of more than 7000 children in the age group of 5 to 18 years. Juvenile justice board and child welfare committees are functioning in all the 14 districts. At present skill development training is imparted to the inmates but they have to be improved with different vocational trades.
Adoption Services
4.163 Adoption is recognized as the best non institutional form of child care to discarded children or children without parent or children without a family set up. The Kerala State Council for Child Welfare started this programme in 1979 and now in Kerala 3 adoption centers and 17 registered placement agencies are functioning. A total of 185 children were adopted during 2011 of which, 156 males and 29 females. Details of adopted children are given in Appendix 4.78
Integrated Child Protection Scheme
4.164 The components under the scheme are State child protection units, State child protection society, District child protection society, Child welfare committee, Juvenile justice board, Institutions for children as per JJ Act 2000 and State Adoption Resource Agency. The utilization of funds for the scheme in the eleventh plan was only about 26 per cent. There is difficulty to implement the state specific activities along with the activities in the ICPS guidelines due to lack of matching share from Government of India. The scheme requires consolidation as well as focused efforts to address implementation gaps by constituting state and district child protection society and other statutory bodies as per ICPS guidelines. As part of strengthening the child rights and protection of children the state needs to constitute the State Adoption Resource Agency (SARA) and State Commissions for Protection of Child Rights (SCPCRs).
Child Participation Programmes
4.165 Kerala’s model of Bala Sabha and Bala Panchayat as neighborhood network of children in LSGs for holistic development of child health has been widely acknowledged. Cultivating creative potential in children by providing opportunities to express learn and develop, identifying and nurturing innate talent that leads to the larger goal of recognition and protection of child rights is the prime objective of the programme. As on March, 2012, the formation of 50618 number of Bala sabhas across the State has been completed with a membership of 878826 children.
Nutrition
4.166 The nutritional status of both children and adolescents must have high priority in any strategy for human development. Adolescent girls, pregnant mothers, breastfeeding mothers and young children are the vulnerable groups which require concerted attention. Iron Deficiency Anemia (IDA) and Vitamin A and iodine deficiencies are the major public health problems of these groups. Also, the percentages of overweight children who are at greater risk for non communicable diseases such as diabetes and cardiovascular heart diseases are increasing.
Integrated Child Development Services (ICDS)
4.167 It is one of the largest early child care programmes for improving the nutritional status of women and children by providing an integrated package of services to the beneficiaries such as supplementary nutrition, immunization, health checkup, referral service, health and nutrition education and Pre-school education. The classification of nutritional status of children under ICDS as on March 2012 reveals that Kerala is better than its counter parts in the Southern States but the rate of severely malnourished children is higher in Kerala than that of Tamil Nadu and Andhra Pradesh.
Fig 4.11
Classification of Nutritional Status of Children under ICDS (In percentage)
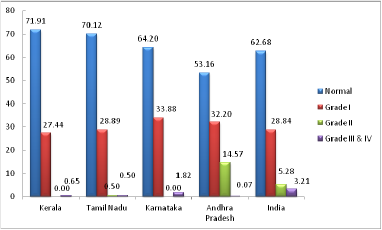
Note: - Grade I & II – Moderately malnourished children
Grade III& IV– Severely malnourished children
Source: Ministry of Women & Child Development, Govt. of India
4.168 In 2007-08, there were 163 projects and 32139 operational Anganwadis in Kerala and now it is increased to 258 ICDS projects and 33115 operational Anganwadi centres. In 2011, this programme benefited about 32 lakh children including pregnant and lactating women. District wise coverage is given in Appendix 4.79
Fig 4.12
Physical Progress of ICDS (Nos. in lakh)
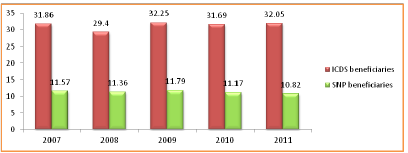
Source: Economic Review 2007 to 2010 & Social Justice Department
4.169 There is no significant improvement in the coverage of ICDS beneficiaries during the 2011-12. Less than 1per cent increase is noted as compared to 2007-08. The coverage of beneficiaries declined all the districts other than Kollam, Thrissur, Palakkad, Malappuram, Kannur and Kasaragod. The coverage of ICDS programme needs to be further strengthened in the remote areas and among under privileged communities in Idikki, Wayanad and Palakkad districts. Supplementary Nutrition Programme is an important component of ICDS services implemented by the LSGs and the programme covers 11 lakh beneficiaries. There is a decline of 6per cent coverage in 2011-12 compared to 2007-08.
4.170 At present, 33115 Anganwadis are functioning in Kerala, of which only 17845 have proper buildings and rest of them are in temporary sheds and other rented buildings that have no basic infrastructure facilities. This can have a significant negative impact on the delivery of services, if left unaddressed. Also chalking out of proper programmes to reduce the prevalence of anemia to 16 percent, the target of XIIth Plan, is quite essential since it is an underlying determinant of maternal mortality and low birth weight. As nutritional status is a sensitive proxy indicator of human development and a key determinant of the effectiveness of the ICDS progrmme, strengthening and restructuring of ICDS in the 12th Plan should be given top priority by the State.
SECTION 5
Drinking Water
4.171 There is a mistaken notion that Kerala is abundant in water resources. Even if the State experiences both South West monsoon and North East monsoon, there is a large spatial and temporal variation in the rainfall system and the abundance of water resources in one season leads to shortage in next season. Due to the rapid urbanization, increased economic activity, population explosion, changes in land use pattern and higher standard of living, the gap between the demand for and supply of water has been widening. To meet this demand, augmentation of existing water resources by development of additional sources of water or conservation of the existing resources through impounding more water in the existing water bodies and its conjunctive use is required. An integrated water management system is essential to ensure sufficient water in the entire system. Rain water harvesting and ground water recharge programme must be effectively implemented to reduce the consumption of potable water and sustainability of ground water resources.
4.172 Primary responsibility of providing drinking water facilities in the country rests with the respective State Governments. However, Central Government formulates policies to supplement the State Government initiatives through Ministry of Water Supply and Sanitation. Accelerated Rural Water Supply Programme (ARWSP), now renamed as National Rural Drinking Water Programme (NRDWP) is the major programme of GoI, which formulates guiding policy, sets standards, and provides funds and technical assistance to the states for rural water supply and sanitation. The 73rd and 74th amendment to the constitution has been a landmark policy shift from a supply-based approach to demand-driven strategy by providing greater role for community participation. As on 31.03.2012, the existing water supply schemes in Kerala have covered 77 percent of the total population. Out of the total coverage, 71 percent are rural and 29 percent are urban population. However, the state has been facing many challenges in terms of quality, quantity and sustainability of water resources.
State Water Quality Profile
4.173 According to World Health Organisation 88 percent of the diarhoea disease is attributed to unsafe water supply and inadequate sanitation practices in the world. Since well water is the major source in Kerala, bacterial and chemical contaminations in drinking water are high. As per Ministry of Drinking Water and Sanitation, GoI, Kerala has the highest chemical /bacterial contaminated drinking water among 28 tested states in the country. As on 09.01.2013, out of the total 102900 tested sources from Kerala, nearly 34 percent have been identified with the contamination of Iron, Fluoride, Salinity, Nitrate, Arsenic and other bacterias (Appendix. 4.80). Quality profile of drinking water in Kerala and other southern states of India are given in Fig. 4.13
Fig 4.13
Quality Profile of South Indian States
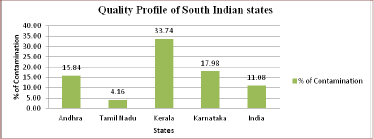
Source: Ministry of Drinking Water and Sanitation, NRDWP,GoI.
4.174 District wise, Kozhikode has the highest chemical/bacterial contaminated water in Kerala. Out of the 10803 tested sources, 54 percent of samples have been found as contaminated sources. Thiruvananthapuram, Kannur, Kasaragod, Ernakulum and Palakkad are other vulnerable districts in terms of access to safe drinking water in the state. District wise quality of drinking water is given in Fig. 4.14 ( also see Appendix 4.81)
Fig 4.14
District Wise Water Quality Profile in Kerala
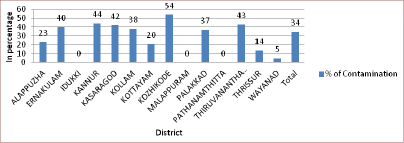
Source: Ministry of Drinking Water and Sanitation, NRDWP,GoI.
Availability of Drinking Water
4.175 Based on the distance, Census of India 2011 classified water source availability into three category such as Within the premise, Near the premise and Away from premise *. In Kerala 78 percent of the people are availing drinking water from their own premises, 14 percent of the people depend upon Near the premises and 8 percent Away from the premises. However, in Idukki district, 27 percent of the people are depending on Away from the premises, 31 percent from Near the premise and 41 percent within the premises.
Fig 4.15
Availability of Drinking Water in Kerala
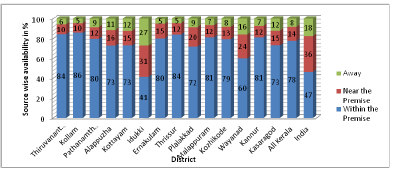
Source: Census of India 2011
4.176 In rural Kerala, 72 percent of people having drinking water within the premises. District wise, Kollam has the highest access of 85 percent and Idukki has the lowest access of 39 percent. For urban region, Thiruvananthapuram, Kollam and Pathanamthitta have the highest levels of more than 86 percent within premises and Wayanad has the lowest level of 74 percent. In Alappuzha nearly 11 percent of urban people do not have drinking water access within or nearby premises. (Appendix 4.82)
4.177 Rural drinking water is one of the six components of Bharat Nirman Programme of GoI. Even if the existing schemes have greatly increased the coverage of safe drinking water in the rural areas of the country, the provision of drinking water to rural areas is fraught with problems. Many habitations which once came under the “covered” status have been found to slip down to the “partially covered” or even “uncovered” status. As per the Ministry of Drinking Water and Sanitation, GoI, there are 11883 habitations in Kerala, of which 934 habitations have been slipped back in 2011-12.The highest frequency reported in Alappuzha with 19 percent, followed by Palakkad as 18 percent and then Kasargode by nearly 14 percent (Appendix 4.83).
4.178 Major reasons for this slipped back status may be the drying of sources, system working below rated capacity due to poor operation and maintenance, sources becoming quality affected, increasing in population resulting into lower per capita availability and the emergence of new habitations.
Piped Drinking Water Supply
4.179 People in Kerala mainly rely on wells for their drinking water purpose. There are only 29 percent of the households dependent on the tap water system (Census 2011). Percentage of households depending on well water is 62, the Handpumps /Tubewells/Borehole water covers 4 percent and the remaining nearly 5 percent avail water from other sources. National average of people using tap water system is 43.5 percent. Neighboring states have made remarkable achievement in tap water system. Tamil Nadu provides tap water system for nearly 80 percent of people, Andhra Pradesh (70 percent) and Karnataka (66 percent).
Fig 4.16
Piped Drinking Water Access in Kerala
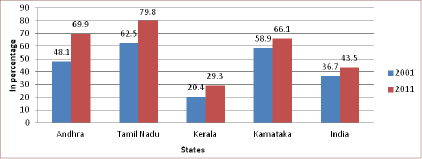
Source : Census of India 2011.
4.180 Within Kerala, Kannur has the lowest access to tap system with nearly12 percent of tap system, followed by Kasaragod having 13 percent and Malappuram 15 percent. Under well system, Kannur has the highest level of 81 percent followed by Malappuram with 78 percent and then Pathanamthitta as 74 percent (Appendix 4.84).
Coverage
4.181 Kerala Water Authority (KWA) is the primary drinking water supplier in the state. It covers 94 percent of total piped water supply in Kerala. Other agencies which provide water supply in rural area are Kerala Rural Water Supply and Sanitation Agency (KRWSA) and Local Self Government Institutions (LSGIs). KRWSA and LSGIs have been ensuring community participation in implementation of water supply schemes by sharing the financial costs and taking responsibility in management, operation and maintenance to some extent.
4.182 Government of India has classified all habitations into three categories – Not Covered (NC), Partially Covered (PC) and Fully Covered (FC)*. Since 2009, the service level has been left to the States to decide with the condition of basic 40 litre percapita per day(lpcd) level should be achieved for all habitations before taking up higher norms for any area. The percentage of population covered by water supply schemes of KWA as on 31.03.2012. Ernakulam is the highest with 97 percent and Kozhikode is having the lowest coverage of little over 54 percent.(Appendix 4.85 ) For rural water supply coverage, again Ernakulam is the highest of 98 percent and Kozhikode is the lowest coverage of nearly 42 percent. In urban area, Malappuram is the highest covered district with 99 percent and Wayanad is the lowest one with 50 percent.
4.183 Additional coverage during the period 2011-12 was for 5.78 lakh people. The whole additional coverage is reported from rural water supply coverage by means of 19 additional Single Panchayat Schemes and 7 Multi Panchayat Schemes. There is no change in the number of urban water supply schemes during the period 2011-12.This rural additional coverage is reported from seven districts and the remaining seven districts have been reported as zero additional coverage. Thiruvananthapuram has the highest additional rural coverage of 1.83 lakh people, followed by Malappuram as 1.52 lakh people. Kozhikode is one of the zero additional coverage districts where the rural drinking water coverage is very low in Kerala.
Fig 4.17
Coverage of Water Supply Schemes in Kerala
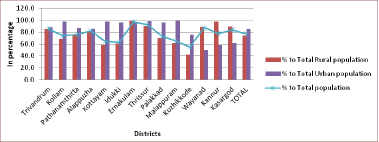
Source: Kerala Water Authority
Production and Distribution of Water
4.184 Due to the lack of preventive maintenance and replacement of old pipes, a considerable portion of the produced water has been reported as distributional loss. As on 2009-10, Kerala Water Authority produced water at the rate of 1890.64 million litres per day(mlpd) and distributed at the rate of 1417.90 mlpd through piped water supply system. The unaccounted for water (ufw) is 543 mld, which implies that the estimated distribution loss of water produced is 25 per cent. Production and supply of water by Kerala Water Authority for the period 2005-06 to 2009-10 is given in the Fig. 4.18
Fig 4.18
Production and Distribution of Water
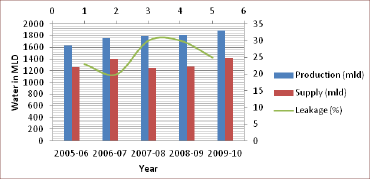
Source :Kerala Water Authority
Plan Fund Utilization Pattern
4.185 During the XIth Plan, 10.68 percent of State Plan outlay was dedicated to water supply and sewerage development in Kerala, which is nearly 33 percent of the fund allotted to the social service sector. The State experienced barely 65 percent of expenditure against the national level of 96 percent*. Performance of plan fund utilization of Kerala and other Southern States during the 11th Plan are given in Fig. 4.19
Fig 4.19
XIth Plan Fund Utilisation Pattern
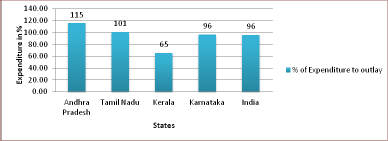
Source: Planning Commission, GoI
Kerala Water Authority
4.186 Kerala Water Authority (KWA) is an autonomous body of Government of Kerala which implements various schemes by considering the need for extending the coverage of protected water supply in the State. As on 31/3/2012, there are 2188 water supply schemes operating under KWA. Of which 71 are urban schemes and 2117 are rural schemes. Among the rural schemes, 985 are Multi Panchayat schemes and 1132 are Single Panchayat schemes. Under urban water supply schemes Ernakulam holds greatest level of 14 Schemes, followed by Thrissur as 12 schemes. In rural water supply, Thrissur has the highest level of 147 Multi Panchayat schemes and 104 Single Pachayat schemes and Wayanad has the lowest level of 62 rural water supply schemes, of which 30 Multi Panchayat schemes and 32 Single Panchayath schemes (Appendix 4.86). Currently under NRDWP, KWA has 70 ongoing Accelerated Rural Water Supply Schemes (ARWSS) and 68 NC/PC schemes.
4.187 In decentralized planning, KWA has been undertaking deposit works from local bodies. As on 31.03.2012, there are 2270 ongoing works have been in different stages of implementation and most of these works are line extension proposals. A special package for the completion of ongoing Urban Water Supply Scheme (UWSS) was introduced by the government in 2009-10. Adding to that KWA introduced “Varsha”, a rain water harvesting scheme. Since 2002, there are 4532 units of Varsha has been completed in four districts of Thiruvananthapuram, Apappuzha, Kottayam and Ernakulam.
Expenditure Pattern of KWA
4.188 Plan fund is the major source of revenue of KWA, which accounts little over 40 percent of total receipts during the year 2011-12.Other sources of receipt for the same period are revenue from Water and Sewerage, which covers 30 percent of total receipt, the Non-Plan fund of state government coming around 17 percent, from Government of India nearly 11 percent and other sources around 2 percent (Appendix 4.91). Expenditure pattern of KWA shows that Plan expenditure has been decreased from 58 percent in 2007-08 to around 41 percent in 2011-12.Consequently, Non-Plan expenditure increased from 42 percent to 59 percent. Component wise proportion of Plan and Non-Plan expenditure of KWA is given in Table 4.19. Inside Plan expenditure central assisted schemes and externally assisted schemes have obtained bigger portion in 2007-08. During 2011-2, ie. final year of the 11th Plan expenditure on State plan schemes acquired highest portion by little over 54 percent.
Table No.4.19
Plan and Non-Plan expenditure trend of KWA
(In percentage)
2007-08 |
2008-09 |
2009-10 |
2010-11 |
2011-12 |
|
Plan Exenditure |
|||||
| State Plan Schemes | 8.99 |
8.32 |
36.39 |
9.61 |
54.51 |
| LIC/HUDCO | 2.43 |
||||
| Externally Assisted | 75.83 |
74.25 |
50.57 |
48.43 |
40.50 |
| Centrally Assisted | 12.75 |
13.73 |
13.04 |
8.17 |
4.98 |
| Others(if any) | 3.70 |
33.78 |
|||
| Total Plan Expenditure | 100.00 |
100.00 |
100.00 |
100.00 |
100.00 |
| Non-Plan Expenditure | |||||
| Salary & Establishment | 44.30 |
54.47 |
46.21 |
45.92 |
53.89 |
| Power Charge | 29.83 |
20.06 |
25.25 |
21.87 |
21.39 |
| Operation & Maintenance | 10.68 |
10.70 |
9.12 |
7.93 |
10.84 |
| Interest on Loans | 5.99 |
5.72 |
9.35 |
6.98 |
5.36 |
| Repayment of Loans | 7.59 |
7.43 |
8.72 |
16.11 |
7.29 |
| Others | 1.61 |
1.62 |
1.37 |
1.20 |
1.23 |
| Total Non-Plan Expenditure | 100.00 |
100.00 |
100.00 |
100.00 |
100.00 |
Source: Kerala Water Authority
4.189 For Non-Plan expenditure salary and establishment is the major part which was 44 percent in 2007-08, which was increased to 54 percent in 2011-12. Even though expenditure on power charge has been reduced from nearly 30 percent to 21 percent, KWA is one of the major defaulters to Kerala State Electricity Board.
JICA Assisted Kerala Water Supply Project
4.190 The JBIC assisted Kerala Water Supply Project currently known as JICA assisted Kerala Water Supply Project envisages the implementation of five water supply projects at Thiruvananthapuram, Meenad, Cherthala, Kozhikode and Pattuvam at a revised estimated cost of र.2987.40 crores. Twenty five contracts have been involved in the project and as on 31.08.2012, 89 percent of the work has been completed. The project covers a whole range of engineering aspects including water intakes, raw water pumping and transmission, water treatment plants, treated water pumping and transmission, service reservoirs, booster stations, distribution systems, various investigations and surveys and rehabilitation of existing treatment plants and pipelines. Allocation under JICA is the major source of plan fund for KWA. Budget provision under JICA for the year 2012-13 is र. 300 crore and the expenditure upto December 2012 is 49 percentage.
Jalanidhi Project
4.191 Jalanidhi is a World Bank aided rural water supply and Sanitation project. It is based on the cardinal concept of sector reform like demand responsiveness, community ownership and sustainability of investment through cost recovery. Kerala Rural Water and Sanitation Agency (KRWSA) is the implementing agency functioning under the Department of Water Resource, Govt. of Kerala. Activities under Jalanidhi are Small Water Supply Schemes, Comprehensive Water Supply Scheme,Construction of Latrine, Ground Water Recharge, Environmental Management Projects and Drainage works. There are 3694 small water supply schemes and 16 large water supply schemes commissioned under Phase one of the Jalanidhi scheme which covered 1.92 lakh of people. The second Phase of the scheme targets 18.4 lakh people from 200 grama panchayats. Physical performance of Jalanidhi project is given in the Annexures.13.35 and 13.36.
12th Plan Target
4.192 The demands of a rapidly industrializing economy and urbanizing society come at a time when the potential for augmenting supply is limited, water table is falling and water quality issues have increasingly come to the fore. The 12th Plan envisages many policy changes for providing drinking water supply schemes of both central and state governments. To achieve the ultimate goal of providing households with safe drinking water supply at the rate of 70 lpcd, 12th Plan has proposed to increase forty years service level of 40 lpcd to 55 lpcd. Participation of beneficiaries especially women, in water supply schemes will be ensured right from the conceptualization stage, spanning construction and post-scheme completion management stages. Capacity building of members of the village water and sanitation committee is of critical importance here. All government schools and anganwadis will be provided with water supply for drinking and for toilets as per the relevant quality norms by convergence of NRDWP for existing schools and through Sarva Siksha Abhiyan (SSA) for new schools set up under SSA. For private schools supply, water will be ensured by enforcement of the provision of the Right to Education Act by the Education Department. Mining activity should only be carried out at a safe distance from major drinking water sources to protect the quality and sustainability of the resources. Care will be taken to ensure that minimum distance is maintained between the toilet system and water resource to alleviate the problems of nitrate contaminations. Providing safe drinking water will be the basic priority for a healthy community all over Kerala.
SECTION 6
Gender Development
4.193 The Eleventh Plan placed considerable emphasis on gender auditing and gender budgeting of major development policies and programmes. Gender auditing is concerned with the assessment of the gender impact of policies and programmes not just in technical terms but also in terms of overcoming the personal and institutional biases in the culture of the relevant organizations which hinder the achievement of gender equality objectives.
4.194 The Twelfth Plan’s emphasis is to increase women’s employability in the formal sector as well as their asset base. It will improve the conditions of self employed women. Focus will be on women’s workforce participation particularly in secondary and tertiary sectors, ensuring decent work for them, reaching out to women in agriculture and manufacturing, financial inclusion, and extending land and property rights to women.
4.195 The paradox of the status of women in Kerala lies in the confusion between ‘gender equality’ and ‘gender equity’. The notion of gender equality assumes that the needs and interests of women and men are identical, whereas the notion of gender equity presumes they are different. Policies and plans should take this into consideration and the differential needs be addressed to achieve gender justice.
The Status of Women in Kerala
4.196 It is widely acknowledged that women in Kerala are much better off than their counterparts elsewhere in India and development scholars point to past and current levels of female literacy and education, late age of marriage, declining fertility and greater life expectancy to establish this fact. In recent times, these ‘conventional indicators’ are under the scanner as various other indicators like decreasing sex ratio among 0-6 age group (male preference), work participation rate lower than the national level ratio, increasing violence against women and low political participation are becoming concerns.
Assets, Resources, Infrastructure
4.197 Lack of access to assets and resources is symptomatic of underlying discrimination, exploitation and exclusion. In Kerala which had a matriarchal tradition, most women do not own any property in their own names. Only 24 per cent women have operational landholdings. Women’s control over and access to income from land is limited. Gender concerns should also reflect in infrastructure development as the needs and interests of men and women are different, especially in transport and urban infrastructure where it is vital to design projects with a ‘‘gender lens’’.
Women in Technical Education
4.198 Rate of enrolment of women in professional and technical institutions is comparatively low. Admissions in Government ITIs cover only 29per cent women students, Polytechnics 36per cent women students and in Engineering it is 30per cent. Girls from adivasi, dalit, fishing and minority communities are still lagging in education. The percentage share of women students in professional and technical institutions in Kerala is given in Fig. 4.20
Fig. 4.20
Percentage of Women Students in Professional Colleges in Kerala
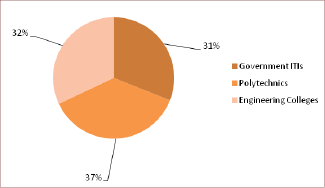
Women in Governance
4.199 To measure women’s empowerment, Gender Empowerment measurement (GEM) takes three indicators, women’s participation in economic, political and professional activities. Within political power what is measured is mainly women in parliament, judiciary or in local bodies. It is also now often pointed out that women’s empowerment must be seen as a process where in we must consider women’s awareness, consciousness, choices with live alternatives, resources at their disposal, voice, agency and participation. These are all related to enhancement of women’s capabilities and decisions they take individually or collectively for themselves.
4.200 Women representation is limited and inadequate in political parties, trade unions and in other positions of political power as well as in decision making processes in professional bodies. Among members of the legislative assembly, less than 10per cent are women. Kerala has twenty nine members in the Parliament out of which women representation is only one (only 3 per cent). Women representation both in mass organizations and high level committees of political parties is negligible. It is only because 50per cent representation for women was made mandatory to local governments, that we see so many women in local governance.
State Women’s Policy
4.201 The State Government has approved a women policy as per G.O. (MS) 13/09/SWD dated 17.02.09. The objectives of the Policy are declaring at least half of the panchayat and municipality areas in the State as zones where there are no crimes against women within two years and make Kerala as State that is free from offences against women in the next five years. To achieve this, Vigilance committee will be strengthened in every area of the State and one day and short stay homes will be established in all the cities. A Committee will be formed to examine loopholes in the laws meant to protect women and to submit its recommendations.
Promoting Gender Mainstreaming through Gender Budgeting
4.202 Kerala has initiated the gender budgeting process at the Local Government level as far back in 1998 and mandated the Local Bodies to allocate at least 10per cent of the plan funds devolved by the State specifically for women (Women Component Plan). A Gender Budget exercise was done on the 2008-09 Kerala Budget. In Kerala, GB focuses on developing schemes that address women’s specific needs and priorities and realigning other existing schemes to make them more gender responsive GRB come in to ensure that funds are made available for these schemes (or components that can contribute to gender equality within existing schemes) to the extent possible.
4.203 Gender Responsive Budgeting is mandatory for all the Departments. The mandatory allocation for women addresses the economic empowerment of women through the Self Help Groups (SHGs) and through income generation programmes under the poverty eradication mission of Government – the Kudumbasree.
4.204 Effective and equal participation in political process, representation in political bodies, legislatures, local bodies etc are the tool for ensuring participatory planning and budgeting. To facilitate women’s participation in the public sphere, Gender Friendly Infrastructure has been formulated (Infrastructure used in a broad sense to include social infrastructure to facilitate women’s participation in the economy as well in addition to physical infrastructure). Several departments are involved in this scheme including KSRTC, PWD, Police, Ports, Housing and also Health, Social Welfare and IT sector.
4.205 As the part of Decentralised Planning, Social Audit has been introduced in the LSGD level. It is one of the tools for effective monitoring and evaluation of the gender specific schemes. The gender budgeting tool has to be done through
• Spatial mapping of status of women and resources to ensure progressive and universal
coverage
• Coordination of the flow of public resources to facilitate and ensure convergence of resources
with synergy across and within various levels of Government
4.206 State government has taken certain initiatives in terms of women targeted schemes (gender responsive) through Flagship programmes in the 11th plan. These are the 1) gender awareness programmes including the implementation of the protection of women from domestic violence act 2)and the flagship programme on finishing schools for women (to enhance employability of women through skill training. The total outlay earmarked for women accounted for only 5.5per cent of the total state budget outlay in 2008-09, which is increased to 8.5per cent in 2010-11 and 10per cent in 2011-12.
Gender Based Violence
4.207 The problem of gender based violence is getting worse. National Crime Records Bureau statistics shows that crimes against women has increased by 7 percent nationwide since 2010. There has been a rise in the number of incidents of rape recorded too. In 2011, 24,206 incidents were recorded, a rise of 9 percent from the previous year. More than half of the victims are between 18 and 30 years of age. Figures indicate that nearly 11 percent of total victims of rape were girls under the age of 14 and 18. Alarmingly, in almost 94 percent of cases, offenders were known to the victims and those involved included family members, relatives and neighbours. Due to “family honour” many complaints files are withdrawn and in many cases the police do not give a fair hearing.
4.208 In spite of all the positive indices of better quality of life, Kerala is ranked high in crime and suicide rates. As per the records of National Crime Records Bureau, the total rate of crimes is higher than that of the national average. The rate of violent crimes is high against children and women. Among the cities in Kerala, Kozhikode has the highest crime record followed by Thiruvananthapuram. The atrocities against women have also increased.
Crime against Women
4.209 Violence against women is another important issue which affects the empowerment of women. To effectively deal with the problem of violence against women efforts are being made to strengthen the existing legislation through review and amendments and developing institutional mechanisms. Despite these numerous efforts, crimes against women in the country continue to rise. Although women may be victims of any of the general crimes such as ‘Murder’, ‘Robbery’, ‘Cheating’, etc, only the crimes which are directed specifically against women are characterized as ‘Crimes against Women’. Various new legislations have been brought and amendments have been made in existing laws with a view to handle these crimes effectively. These are broadly classified under two categories.
(1) The Crimes under the Indian Penal Code (IPC)
(i) Rape (Sec. 376 IPC)
(ii) Kidnapping & Abduction for specified purposes (Sec. 363 - 373 IPC)
(iii) Homicide for Dowry, Dowry Deaths or their attempts (Sec. 302/304-B IPC)
(iv) Torture - both mental and physical (Sec. 498-A IPC)
(v) Molestation (Sec. 354 IPC)
(vi) Sexual Harassment (Sec. 509 IPC)
(vii) Importation of girls (upto 21years of age) (Sec. 366-B IPC)
(2) The Crimes under the Special & Local Laws (SLL)
4.210 Although all laws are not gender specific, the provisions of law affecting women significantly have been reviewed periodically and amendments carried out to keep pace with the emerging requirements. The gender specific laws for which crime statistics are recorded throughout the country are –
(i) Immoral Traffic (Prevention) Act, 1956
(ii) Dowry Prohibition Act, 1961
(iii) Indecent Representation of Women (Prohibition) Act, 1986
(iv) Commission of Sati (Prevention) Act, 1987
4.211 The rate of crime against women meant number of crimes against women per one lakh population. NCRB’s “Crime in India 2011” report has ranked Kerala next to Assam with 33.8 per cent rate of crime against woman. Andhra Pradesh and West Bengal were placed at fourth and fifth positions respectively. Andhra Pradesh has registered 33.4 per cent of crimes against women last year while West Bengal stood at 31.9 per cent. The NCRB report further said that there were 2, 28, 650 incidents of crimes against women in the country out of which Assam registered 11, 503 incidents. Nagaland has the lowest rate of crime against women among the north eastern states with only 1.9 percent. NCRB registered only 38 cases of crime against women in 2011. The crime against women for the year 2010 is given in the Table 4.20
Table 4.20
Crime against Women in India 2010
| Sl. No | Crime | Case Reported |
per cent to total IPC Crimes | Rate of crime | Charge sheeting rate | Conviction Rate |
| 1 | Kidnapping & Abduction of Women and Girls | 29795 | 1.3 | 2.5 | 74.2 | 28.1 |
| 2 | Molestation | 40613 | 1.8 | 3.4 | 96.7 | 29.7 |
| 3 | Sexual Harassment | 9961 | 0.4 | 0.9 | 96.7 | 52.0 |
| 4 | Cruelty by Husband and Relatives | 94041 | 4.2 | 7.9 | 94.2 | 19.1 |
| 5 | Importation of Girls | 36 | 0.0 | 0.0 | 90.6 | 20.0 |
| Total Crime Against Women | 213585 | 9.6 | 18.0 | 92.0 | 27.8 |
Source: Crime in India, 2010
4.212 The total number of Crime against women (both IPC and SLL Cases) in Kerala for the last four years is given in Fig 4.21
Fig 4.21
Total Number of Crimes reported in Kerala for the last 4 years
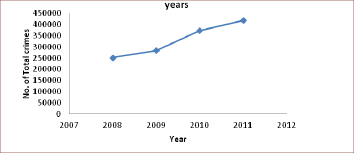
4.213 Gender sensitivity of a society embraces a whole gamut of concerns.In fact, Gender sensitivity level of a community would include not only the status women occupied in familt, work place and public sphere but also other gender equations.This could be in the form of deeply entrenched discrimination aganist the female sex .mirrored by the media too, the extent to which the local bodies and state governments are willing to allocate resources through gender budgeting for the upliftment of women so on and so forth.The entire issue hinges on the extent to which the society/community is conscientised(and the level of sensitsation of male is vital indicator) and that is the factor that wouled ultimately lead to the empowerment of women in all spheres of activity in society.
SECTION 7
Welfare of Scheduled Castes, Scheduled Tribes Other Backward Classes and Minorities
4.214 The upliftment of the socially and economically backward sections of the society especially the Scheduled Castes and Scheduled Tribes and Backward Communities has been a major challenge to the successive Governments since Independence. Reservation in jobs and admission to educational institutions alone are not sufficient to solve the problem. The fact that the educational and social backwardness of SCs/STs deprive them to get the benefits of the schemes announced in the plan and budget led to Governments implementing separate schemes for their welfare, which eventually resulted in the introduction of Special Component Plan and Tribal Sub Plan in its present form. Compared to the status of SCs/STs at national level, in Kerala their position regarding sex ratio poverty, literacy and number of slum dwellers is better. Appendix. 4.96 presents comparison of the national and state level status.
4.215 As per Census 2011 Scheduled Caste Households in Kerala have much greater access to banking services, Landline Phones, Computers with Internet and Car than an average Scheduled Caste household in India Appendix.4.97. Compared to other Southern States of Tamil Nadu, Karnataka, and Andhra Pradesh, only SC households in Tamil Nadu have greater access to Televisions than those in Kerala. SC households in Kerala do not seem to have as much access to two wheelers as other SC households in India. While more than 22per cent of SC households in India did not have access to any of these assets, Kerala performed better as only around than 11per cent of SC households were deprived of these assets.
4.216 Similarly in the case of Scheduled Tribes, these households in Kerala have much greater access to banking services, Television, Computer with Internet, Land line and car than an average scheduled Tribe household in India Appendix.4.98. Compared to other southern states only Scheduled Tribe households in Tamil Nadu has greater access to Televisions, Computer with Internet, Landline Phones and Car than Kerala. Scheduled Tribes households in Kerala do not seem to have as much access to two wheelers as other Scheduled Tribe households in India. While more than 37per cent of Scheduled Tribes Households in India did not have access to any of these assets, Kerala performed better as only around 24per cent of Scheduled Tribes household being deprived of these assets.
4.217 Thus Scheduled Caste and Scheduled Tribe households in Kerala have a better standard of living than their counterparts in the rest of the country. However Tamil Nadu has shown an even better standard of living for Scheduled Tribe households than Kerala.
4.218 In Kerala there are 53 communities which belong to Scheduled Caste as per the Amendment Act of 2006 to the Constitution of India. The settlement pattern in Kerala is entirely different from that of other states and a major portion of the Schedule Caste population lives in scattered households with other people and only a small portion live in concentrated colonies, in which very limited number are isolated. The highest distribution of Scheduled Castes is in Palakkad District (13per cent) followed by Thiruvananthapuram (12 per cent), Thrissur (11 per cent) and Kollam (10per cent). Nearly half of SC population of the State is distributed in the above four districts. The Scheduled Tribes in Kerala are not only geographically concentrated, but are overwhelmingly rural. Highest concentration of Scheduled Tribes is seen in Wayanad district (37 per cent) followed by Idukki (14 per cent) and Palakkad (11per cent) and these three districts together account for over 60 per cent of STs in the State. The coastal district of Alappuzha has the lowest percentage (0.15per cent). Details are given in Appendix 4.99 District wise Scheduled Caste/Scheduled Tribe population details are given in Appendix.4.100.
Occupational Pattern
4.219 Appendix 4.101 shows that while only around 26 per cent of total population were main workers as per 2001 Census, the corresponding figures for SC and ST population are around 30per cent each indicating that a moderately high proportion of the disadvantaged groups are workers. The ratio of female workers belonging to SCs and STs is almost double than that of general population. It is significant to note that the decline of workers among total population was marginal during the decade 2001 compared to 1991, it is substantial in case of SCs and the same is alarming for STs during the period. The decline in the proportion of main workers, both male and female, is not a welcome change as it is indicative of growing unemployment, underemployment and deprivation among the population.
4.220 An analysis of the available data indicates excessive dependence of STs on agriculture (55 per cent) for their livelihood as against just 20per centfor the total population and for SCs the corresponding figure is 31per cent. Other services is the source of income for 77 per cent of the total population, while this sector offers livelihood for only two third of the SC population. The above analysis of the occupational pattern shows that the SC population is closely following the general population with regard to the change in occupational structure that has been taking place in the Kerala economy while the ST population is far behind in this respect.
4.221 In Kerala, as per Rule 14(a) of the Kerala State and Subordinate Service Rules 1958, 8per cent reservation in Public service is provided to SCs and 2per cent to STs. It shows that SC/ST had already achieved more than 10per cent reservation in all the three categories. But ST candidates alone had not achieved 2per cent reservation in State service. Details of representation of SC/ST employees in Government service is given in Appendix 4.102
Development Programmes for Scheduled Caste and Scheduled Tribes
4.222 Kerala Government earmarks funds for SCP and TSP from State Plan outlay in proportion to the ratio of population of Scheduled Castes and Scheduled Tribes to total population of the State. Out of the total SCP/TSP Plan outlay, a certain percentage of funds are allocated to Local Self Government Institutions for implementation of schemes under Decentralized Planning. A portion of funds was considered as Notional Flow to other departments till 2008-09. This was meant for implementing schemes exclusively for SC/ST population in the respective sectors. As this experiment was not found successful, the concept of Notional Flow was dispensed with from the Annual Plan 2009-10. A system of earmarking certain amount of SCP/TSP as pooled fund under SCP and TSP for taking up schemes adopting a project approach was introduced. This gives scope to get wide range of schemes with varied objectives and physical targets, which put together, will help the all round development of the target groups. The total plan provision set apart for the development of Scheduled Caste and Scheduled Tribes during 2012-13 was र 1289.21 crore and र 312.41 crore respectively. Year-wise details of SCP/TSP Outlay from 2007-08 to 2012-13 are given in Appendix 4.95 In the first year of the 12th Plan (2012-13) there was 89 per cent increase in outlay for SCP and 125per cent increase in outlay for TSP compared to the first year of the 11th Plan (2007-08).
Fig 4.22
SCP/TSP-Yearwise Outlay
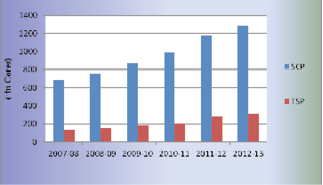
4.223 A two pronged strategy is followed for development of Scheduled Castes and Scheduled Tribes in the state. Infrastructure facilities like roads, electricity and water supply are provided in habitats having more than 50 per cent SC/ST families. For implementing minor irrigation work, more than 50 per cent of the area should be owned by Scheduled Castes, Scheduled Tribes, whereas, for projects benefiting individuals and families, 100 per cent of the beneficiaries should belong to SCs, STs.
Special Component Plan and Tribal Sub Plan through Local Governments
4.224 During the year 2011-12 a total of र 648.44 crore was given to Local Governments as plan grant under Special Component Plan and र 97.31 crore as Tribal Sub Plan. Budget provision of SCP/TSP through LSGIs during 2012-13 is given in Appendix 4.104
Fig. 4.23
Budget Provision of SCP through LSGIs 2012-13
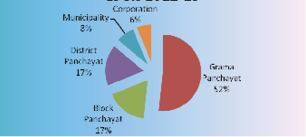
Fig 4.24
Budget Provision of TSP through LSGIs 2012-13
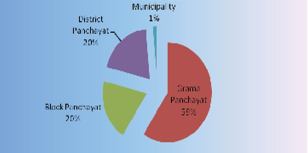
Programmes of Scheduled Caste Development Department
4.225 State Schemes and Centrally Sponsored Schemes as well as the projects taken up under corpus fund and pooled fund are the programmes implemented by the Scheduled Caste Development Department for the welfare of Scheduled Castes. During 2012-13 the total State Plan provision set apart for the development of Scheduled Castes is र 1289.21 crore. Out of this, र 549.75 crore is earmarked as State Share for development programmes of the SC Development Department. An amount of र 739.46 crore is provided as Development fund to local bodies. An amount of र 17.00 crore is 100per cent CSS and the Central Share of 50per centCSS is र 13.37 crore during 2012-13. In addition to this र 10 crore is included in the budget as Special Central Assistance to SCP.
4.226 The State and Central government programmes cover a wide area comprising education, economic and social welfare activities for the development of Scheduled Castes which has produced favourable results in these areas. Scheme wise outlay and expenditure for welfare of Scheduled Castes for 2011-12 & 2012-13 and the physical targets and achievement are given in Appendixes 4.105 and 106 respectively.
Educational Schemes
4.227 The Scheduled Caste Development Department is implementing various educational schemes such as pre-matric scholorships, post-matric scholorship, running/construction of Model Residential Schools, assistance to students studying in self financing colleges etc. During 2011-12, pre-matric educational concessions to र 4.51 lakh students and post-matric concessions were given to more than 1.28 lakh students. An amount of र 95.39crore has been spent towards stipend and lump sum grant and an amount of र 19.92 crore has been spent for providing scholarship for post matric students. The details of educational assistance given to SC students are shown in Appendix. 4.107
e-Grants
4.228 One of the major achievements in education sector is the introduction of e-Grantz for the online distribution of educational concessions to the students belonging to the weaker sections of the society. As a pilot project, the web based scholarship distribution system was introduced among 3000 SC students in 52 post-matric institutions in Alappuzha district during 2008-09 in association with State Bank of India. This project was extended across the whole of Kerala during 2010 and is benefiting students of 3450 educational institutions in the State. The project helps the students for getting assistance through ATMs. During the year 2011-12, SBI eZ-pay card has been introduced for disbursement of students entitlements, which enables speedy disbursement eliminating the delay in opening individual bank account for students.
Housing Scheme
4.229 The department is giving housing assistance @ र 200000 for constructing a house from 2011-12.
4.230 The details of houses sanctioned and constructed during the period from 2008-09 to 2011-12 are given in Appendix. 4.108 In 2011-12 3500 houses were sanctioned and 416 houses completed.
e-Housing
4.231 The Department of Scheduled Caste Development has launched e-Housing, an online system of granting financial aid for house construction to the Schedule Castes. The e-Housing website was launched on February 27, 2011. After the successful implementation of e-Grantz, this is another step forward in e-governance for the Kerala Scheduled Caste Development Department. E-Housing will make the whole process of sanctioning and distribution of monetary assistance under the Bhavana Nirmana Dhanasahayam Scheme time-bound, efficient, transparent and easy as 90per cent of the work will be done online by the software.
Land to Landless
4.232 The policy of the Government is that all the Scheduled Castes will be provided with land for construction of house. The scheme intends to purchase land to the poor and eligible landless Scheduled Castes for construction of house. An amount of र 6827.67 lakh was provided during 2011-12 and the expenditure incurred was र 6826.92 lakh benefitting 4504 persons. The amount provided under land to landless (ACA) is र 1432 and the expenditure is र 1432 lakh. District wise details are given in Appendix.4.109
Health Scheme- Financial Assistance to Seriously Ill People
4.233 Illness assistance is granted up to र 25,000/- to the Scheduled Castes, who are below poverty line and suffer from serious diseases like Cancer, Heart/kidney/brain ailments. During 2011-12, financial assistance was given to 7954 persons.
Development Programmes for the Vulnerable Communities among Scheduled Castes
4.234 The objective of this scheme is rehabilitation of landless and homeless SCs belonging to vulnerable communities viz. Vedan, Vettuvan and Nayadi. This scheme has the following provisions.
• Assistance of र 100000/- for house construction and र 150000/-for purchase of 5 cents of
land in Grama Panchayat area ( र 1.75 lakh in municipalities and र 2 lakh in corporation
area). If fewer amounts are incurred for the purchase of land, the remaining amount can be
utilized for the construction of houses.
• The amount provided is also meant for meeting the expenses in connection with the provision
of education, treatment, drinking water, electricity etc, to the vulnerable groups.
4.235 During 2011-12, र 1044.21 lakh was provided in the budget and the expenditure incurred र 1045.07 lakh. Apart from this scheme, another scheme is being implemented under one time ACA for the rehabilitation of the most economically, socially and educationally backward communities viz.Vedan, Nayadi, Kalladi and Chakkilian. Majority among them are landless and living in huts in ‘Purambok’ area and are in starving conditions.
Self Employment Scheme
4.236 Assistance is given under self employment projects for promoting new ventures among Scheduled Castes in the ratio of 1:2 as subsidy and loan for taking up productive service, market oriented projects. The amount provided for the year 2011-12 was र 807 lakh and the expenditure was र 756.30 lakh benefiting 693 person. Details of district -wise assistance given under self employment scheme from 2008-09 are given in Appendix 4.110
Assistance for Marriage of SC girls
4.237 In order to reduce the burden of marriage expenses of daughters of SC parents, assistance is given under this scheme. Priority is given to the daughters of widows, unwed mothers and impoverished parents. During 2011-12 an amount of र 1607.82 was provided and the expenditure incurred was र 1602 lakh benefitting 7744 persons.
Protection of Civil Rights and Enforcement of Prevention of Atrocities Act
4.238 The activities proposed under this scheme are:
• Conducting awareness camps at Grama Panchayat level highlighting the need for protection of civil rights of Scheduled Castes and enforcement of Prevention of Atrocities Act.
• Producing documentaries highlighting the evils of untouchability against Scheduled Castes.
• Providing assistance to inter-caste married couples for starting economic and income generation activities. During 2009-10 inter-caste marriage assistance was enhanced to र 50000/- from र 10000/-. The expenditure incurred was र 11.18 crore benefitting 3052 persons.
• Celebrating Temple Entry Proclamation day
• Conducting exhibition and procession in connection with Social Solidarity Fortnight
4.239 The number of cases of harassment/atrocities towards Scheduled Castes in the State for which compensation has been granted during the last five years are given in Appendix 4.111
• The nature of these harassment/atrocities are social harassment, sexual exploitation, insult,
intimidation and humiliation, outraging the modesty of woman causing injury and insult or
annoyance, giving false evidence, etc.
• Three Special Mobile Squads are functioning at Palakkad, Wayanad and Kasaragod to deal with
atrocities towards Scheduled Castes more effectively.
• Two Special Courts function at Kalpatta and Manjery
• Atrocity Prone areas are Wayanad, Kasaragod and Attappady in Palakkad.
4.240 According to the National Crime Records Bureau, the year 2011 has witnessed an increase of 30.5 per cent in the incidence of crime committed against Scheduled Castes in Kerala. 583 cases reported in 2010 have increased to 761 cases in 2011. The rate of crime against Scheduled Castes has increased to 2.3 per cent in 2011 as compared to 1.7 per cent in 2010. Details are given in Appendix 4.112
Box 4.14
New Initiatives in SC Department during 2012
Vijnjanvadi
The scheme aims at providing library, reading room, computer with internet facility, dailies and periodicals and necessary furniture to each and every Scheduled Caste colonies in the State. Initially Vijnjanvadis will be started in colonies having infrastructure facilities such as community hall. In other colonies, infrastructure facilities will be provided under the scheme
Toilet
The Scheme aims at providing toilet facility to 25000 SC families who do not have hygienic toilets at their home.
Modernization of Pre-matric Hostels
In 2012-13, SC students of professional courses admitted on the basis of merit list issued by the Government will be provided with Laptop Computers. Under this scheme 450 MBBS students and 5100 Engineering students will be getting Laptop.
Vision 2013
Under this programme, all the Scheduled Caste students who have secured A+, A, B+ and B grades in 10th standard will be given special coaching for appearing for the medical and engineering entrance examination on 2013 through reputed coaching centres.
Critical Gap Filling (Corpus Fund)
4.241 This Scheme intends to provide funds for filling critical gap in the SCP provision made under various schemes on project basis with emphasis on human resource development, basic needs, economic development etc. Two thirds of the outlay will be allocated to districts on population proportion basis. Schemes /projects up to र 25 lakh will be cleared by the District Level Committee for SC/ST. Project above र 25 lakh will be cleared by State Level Working Groups/ Special working Groups. Outlay and expenditure under the scheme during 11th plan period is given Appendix 4.113. and Appendix.4.114
Fig. 4.25
Corpus Fund Allocation from 2007-08 to 2012-13

Pooled Fund
4.242 A system of earmarking certain amount of SCP/TSP as pooled fund under SCP and TSP for taking up schemes adopting a project approach was introduced. This gives scope to get wide range of schemes with varied objectives and physical targets which put together will help the all round development of the target groups.
4.243 Various development departments and agencies should submit projects to State Planning Board for consideration. After vetting by Planning Board, it will be forwarded to Scheduled Caste/Scheduled Tribe Development Department. Outlay and Expenditure under the scheme are given Appendix.4.115
Special Central Assistance to Special Component Plan (SCA to SCP)
4.244 The Special Central Assistance to Special Component Plan for Scheduled Caste is provided by Government of India to States for undertaking mainly economic development programmes for Scheduled Castes. It is not on a schematic pattern. It will help to fill the gaps which the flows from the Central, State and Local body plans are not in a position to fill. Out of the total funds received under SCA to SCP, 75 percent will be distributed to the District Collectors on the basis of Scheduled Caste population in the districts. The balance 25 percent will be kept with the Director; Scheduled Caste Development. Activities that can be taken up under SCA are to assist Scheduled Caste families for taking up viable income generating activities, through a mix of institutional finance and subsidy. The families may be provided assistance under SCA in a manner similar to those admissible under Swrnjayanthi Gram Swarozgar Yojana. The outlay and Expenditure details of SCA to SCP from 2007-08 to 2012-13 are given in Appendix 4.116
Scheduled Tribe Development
4.245 From Fifth Five Year Plan onwards (from 1974-75) Tribal Sub Plan is in existence in the State for the overall development of STs in the State. This strategy has undergone several changes since 1974-75 and now it reached a stage in which it has proper linkages with the present Panchayat Raj and Nagara Palika System of administration. As per the TSP strategy the state has been allocating an amount which is more than proportional to the TSP population in the State.
Programmes of Scheduled Tribe Development Department
4.246 An amount of र 186.88 crore was earmarked during 2011-12 for the development programmes of the ST Development Department and the expenditure was 143.39 crore.(76 per cent) The total state plan provision set apart for the development of Scheduled Tribes during 2012-13 is र 312.41 crore. Out of this र 201.43 crore was earmarked as state share for the development programmes of the ST Development Department. An amount of र 110.98 crore was provided as grant in aid to local bodies. For the 50 per cent and 100 per cent CSS Schemes Central Share is र 20.17 crore and र 48.67 crore respectively. In addition to this र 6 crore is included as Special Central Assistance to TSP with state budget. Details of Financial and Physical achievements of schemes implemented by the department during 2010-11, 2011-12 and 2012-13 are given in Appendices 4.117, 4.118 ,4.119 and 4.120
Educational Programmes
4.247 Educational backwardness is the main hurdle in the socio economic progress of the Scheduled Tribes and hence top priority is given for their educational development and about 50 per cent of total budget provision (both plan and non-plan) is set apart for this. The department is distributing educational concessions, scholarships and other kinds of assistance to the tribals from preprimary to post graduate level. Apart from exemption from all kinds of fee, they are given lumpsum grant meant for the purchase of books, stationery and dress materials and monthly stipend at varying rates. There are nearly 82120 pre-matric and 11383 post- matric tribal students in the State.
4.248 Educational concessions, scholarships and other kinds of assistance are provided to tribal students from preprimary level to postgraduate level. Details showing the number of ST students benefitted and amount spent during 2007-08 to 2012-13 are given in Appendix 4.121
4.249 With a view to provide residential education to tribal students from remote areas the ST Development Department is running 107 pre-matric hostels and 3 post matric hostels in the State for providing boarding, lodging and tuition facilities. There are 29 single teacher schools for providing pre-primary education to tribal students living in very remote and inaccessible areas. Of these 27 are in Idukki District.
4.250 For providing pre-primary education to the tribal students, 13 kindergartens and 24 Balawadies are functioning under local self government and the ST department respectively. The nutritional requirements of the children are taken care of to a great extent in these institutions. The Department also runs 19 training centres for imparting job oriented technical training. At present 2per cent of the total seats in educational institutions are reserved for ST students.
4.251 In order to provide quality education to ST students, 18 Model Residential Schools are functioning under this department viz., 15 Ashram Schools in Tribal Sub Plan areas and 2 Ekalavya Model Residential Schools and one special Model Residential[CBSE] school (100per cent Assistance under Art. 275[1]). The Model Residential schools could achieve impressive results in the SSLC examination 2009. Also under the Ayyankali Memorial scheme, selected students from STD. IV and VIII are provided with continuous special tuition and counseling. For imparting primary education to primitive tribe children living in remote tribal settlements, 16 centres are functioning under the scheme “Peripatetic Education Centers of PTG’s”.
4.252 The Department provides tuition fee to ST students who got admission to professional course in self financing colleges under government quota. The plan outlay & expenditure during 2007-08 to 2012-13 in respect of educational sector are furnished in Appendix.4.122
4.253 The details of lumpsum grant, stipend, scholarship etc to Scheduled Tribes students are given in Appendices 4.123 and 4.124
Fig 4.26
Outlay and Expenditure of Education Sector for ST (Plan)
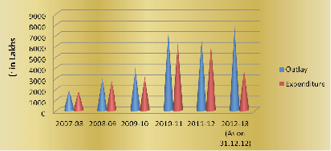
Housing
4.253 During the XIth Five Year Plan, top priority was given for providing houses to all houseless STs in the state. In the XIth Plan, it is proposed to construct houses to all houseless families in a time bound manner. The ST Development Department, Tribal Resettlement and Development Mission, Rural Development Department [IAY Scheme] and the local bodies are the major agencies involved in the tribal housing area in the State.
4.254 The outlay and expenditure of the housing schemes under plan implemented by the Department during the period 2007-08 to 2012-13 are given in Appendix .4.115
Fig 4.27
Housing Programmes undertaken by ST Development Department
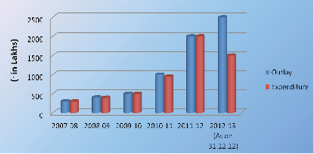
4.255 District wise details of houses constructed by the ST Development Department for 2006-07 onwards are given in Appendix 4.126
Health
4.256 Various measures are taken for providing timely medical attention to STs. The Health Services Department run 63 PHCs in the tribal areas. Besides the ST Development Department has 4 Midwifery centres, 17 Ayurveda Dispensaries, 3 Allopathy Dispensary/O.P. Clinics, 1 Ayurveda Hospital, 2 Mobile Medical units and 1 Allopathy Hospital at Mananthavady. During 2007 the Nalloornad and Attappady hospitals under the ST Development Department were transferred to the DHS and are now functioning well. Apart from the PHCs and Ayurveda Dispensaries, Homoeo Dispensaries are also functioning in tribal areas under TSP of the respective Department. The Health Department conducts medical camps in tribal areas to diagnose diseases. Serious diseases detected are referred to district hospitals and financial assistance given for treatment. Studies by the Health Department as well as AIIMS,New Delhi show that nearly 15 per cent of the tribal families in Wayanad and Palakkad Districts have traits of the genetical problem “Sickle Cell Anaemia”. In order to tackle the problem, Kozhikode Medical College has set up a Sickle Cell Anaemia unit with Electrophoresis machine.
4.257 Outlay and expenditure of health programme (Plan) for the period 2002-03 to 2012-13 are given in the Appendix 4.127
Resettlement of Landless Tribes
4.258 A special scheme for providing land to the landless and houses to the houseless is being implemented in the state. As part of the resettlement of landless, Tribal Resettlement and Development Mission (TRDM) has been formed to undertake rehabilitation activities based on a Master Plan. They have identified 22052 landless tribal families and 32131 families with less than one acre of land. Land distribution was inaugurated on 1/1/2002 and TRDM could so far distribute 8966.34 acres of land to 6800 tribal families as shown in Appendix.4.128
Corpus Fund
4.259 An amount of र 3363 lakh out of the Corpus Fund of र 3355.85 lakh was expended during 2011-12 for undertaking various development activities. The components of the Corpus fund includes self employments, skill development, water supply and sanitation, communication facilities, foot bridges, technology transfer, improvement of education and health etc. Statement showing the outlay and expenditure under Corpus fund from 2007-08 to 2012-13 is given in Appendix 4.129 and the details of schemes taken during 2011-12 and 2012-13 are given in Appendices 4.130 and 4.131
Fig 4.28
Outlay and Expenditure under Corpus fund from 2007-08 to 2012-13

Pooled Fund for Special Projects Proposed by Other Departments under TSP.
4.260 During 2012-13 an amount of र 1250 lakh was provided under the scheme Pooled Fund for special projects proposed by other departments. The expenditure as on 31.12.12 is र 796.62 lakh.
Special Central Assistance to Tribal Sub Plan (SCA to TSP)
4.261 The Special Central Assistance to Tribal Sub Plan released by Government of India as an additive to State Plan Funds is meant for undertaking employment cum income generation activities and the infrastructure incidental to activities based on family and self Help Groups. 70per cent of the fund has been utilized for implementing primary schemes supporting family/SHG/Community based income generation activities and 30per cent used for critical infrastructure in the sectors of Drinking Water, Watershed management etc.
Fig. 4.29
Outlay and Expenditure under SCA to TSP during 2007-08 to 2012-13
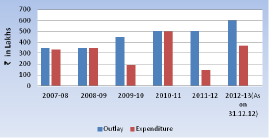
Co-operation
4.262 The SC/ST cooperatives were formed aiming at the overall improvement of the socio-economic conditions of SCs and STs. Through these societies loans are being released and other activities are done. Minor forest produce procurement and sales, other activities like Ayurdhara and Petrol pump are being undertaken by the Kerala State Federation of SC/ST Development Cooperative Limited.
Kerala Institute for Research Training and Development Studies for SC/ST (KIRTADS)
4.263 The Institute conducts research and intensive study on Scheduled Caste and Scheduled Tribe population of the state.
4.264 Anthropological investigation on doubtful community cases as requested by Scheduled Tribe Development Department, Scheduled Caste Development Department, Revenue Divisional Officers, Tahsildars and District Collectors has also been undertaken by the wing.
4.265 The training wing of KIRTADS coordinates and conduct a large number of programmes to promote Tribal Development. This wing also conducted many orientation programmes, capacity building programmes, empowerment programmes and educational programmes.
Welfare of Other Backward Classes
4.266 Government of Kerala created a separate department in November 2011 to look after the welfare of socially and economically backward communities of the society. Though the Directorate of this Department was created at the end of the financial year 2011-12, it implemented two major educational schemes, Pre-Matric and Post-Matric Scholarships with the help of Scheduled Caste Development Department.
4.267 During 2011-12, Pre-Matric educational concession to the students of backward Communities was a pilot scheme of the Department. The State Government contributed र 49 crores for the Scheme (50 per cent CSS). An amount of र 13.31 crores was disbursed for Post- Matric Scholarships (100 per cent CSS)
Development Programmes 2012-13
4.268 During 2012-13, the total amount provide for the welfare of Backward Communities Development Department is र 31.18 crores. Of this र 36.84 crores was earmarked as State share for “Development Programmes” of Backward Communities Development Department.
4.269 This Department has implemented various educational schemes such as Pre-Matric (50per cent CSS) and Post-Matric Scholarship (100per cent CSS) for OBC students, OEC Pre-Matric and Post-Matric Scholarship during 2012-13.
4.270 Backward Communities Development Department has introduced e-grantz for distribution of educational concession to students belonging to Backward Communities.
4.271 Budget 2012-13 has earmarked र 1 crore for giving financial assistance to traditional Pottery workers and an amount of र 0.37 crores is envisaged for giving financial assistance to law graduates belonging to Backward Class facing financial difficulties for starting practice as advocates.
Kerala State Development Corporation for Scheduled Castes and Scheduled Tribes
4.272 The Corporation, with its Registered office at Thrissur, functions through 14 Regional Offices covering all the districts, is implementing various schemes to enable the SC/ST people to become self-reliant in all respects. The sources of finance for implementing various schemes are Corporation’s own share capital and assistance from other national refinancing agencies like NSFDC, NSTFDC, NSKFDC and HUDCO. The Corporation is now concentrating more on self employment schemes to enable the target people to engage in some innovative and viable income generating activities and earn their livelihood and thereby improve their socio-economic status in the society.
4.273 The major schemes implemented by the Corporation include agricultural land purchase, micro-credit finance, mini-venture loans, small enterprise loans, housing, educational loan, marriage assistance etc.
4.274 The scheme wise details of physical and financial achievements of the Corporation are given in Appendix 4.132
Kerala State Backward Classes Development Corporation
4.275 The Corporation aims at the socio-economic upliftment of the backward classes and minorities in the state.
4.276 The Corporation mobilizes funds from the National Backward Classes Finance & Development Corporation (NBCFDC) and National Minorities Development & Finance Corporation (NMDFC) in addition to State Government support. The source-wise expenditure and the physical achievements of the Corporation during 2010-11 and 2011-12 are given in the Appendix 4.133
Kerala State Development Corporation for Christian Converts from Scheduled Castes and the recommended Communities
4.277 The main objective of this Corporation is to promote social, educational, cultural and economic upliftment and other living conditions of the converted Christians from Scheduled Castes and other recommended communities. The main schemes under implementation by the Corporation are agricultural land purchase, foreign employment, housing, cash incentive to students, marriage loan, agriculture and allied sector assistance, small business, educational loan etc. The Corporation implements these schemes with the financial assistance received from state government and the loan assistance from NBCFDC. Details of year wise disbursement of State Government assisted loan schemes for the last 11 years are given in Appendix 4.134.
4.278 The scheme wise details of physical and financial achievements of the corporation are given in Appendix 4.135
Welfare of Minorities
4.279 The Minority Welfare Department was constituted for addressing the social economic and educational backwardness of Minority Communities in the State. An amount of र 2000 lakh was earmarked to Minority Welfare Department during the year 2012-13 for various programmes. The major schemes are (i) Multi sectoral Development Programme (MSDP). (ii) Empowerment of women through Women Self Help Group.
Kerala State Minority Development Finance Corporation
4.280 The State Government constituted the State Minority Development Finance Corporation to provide financial assistance to income generating projects, housing finance educational loans, vocational training etc to minority community.
State Minority Commission
4.281 In the model of National Minority Commission, Government of Kerala have decided to constitute State Minority Commission.
Outlook for Social Services in Kerala
4.282 The State Plans to implement people – centric policies with care and compassion. Inclusive growth, poverty alleviation and improvement of economic and social status of marginalized sectors is the foundation of development planning in the 12th five year plan. Kerala is a beacon of hope for the rest of the country in terms of what can be achieved in the social sector. Great strides have been made in primary and secondary education, infant and maternal health, provision of social security and in the care of the marginalized and vulnerable sectors of society viz. SC, ST, Minorities, Elderly, Women and Children. Nevertheless, in order to ensure that the quality of life in Kerala continues to be high, some major concerns have to be addressed effectively through targeted Government interventions and community support. These areas are falling child sex ratio, poor alignment between higher education and employability, lack of adequate medical and paramedical personnel, growing problem of life-style diseases, special needs of a rapidly ageing population, increasing stress and mental health related problems of the people, growing insensitivity and violence towards women, and alcoholism related problems faced by the society. Access to affordable health care for all is a major priority. All these issues have been in the forefront of planning and policy making in the State but will require greater involvement of community groups to complement the initiatives of the Government.