
Page 250 - economic review
P. 250
222
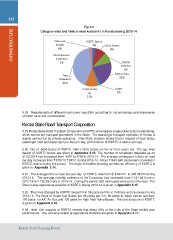
Fig 5.5
Category wise and Vehicle wise Accidents in Kerala during 2013-14
INFRASTRUCTURE
Class not KSRTC Buses
known 3% Other Buses
9%
0%
Goods
Miscellaneou Vehicles
s vehicles
3% 9%
Motor Cars
Two
Wheelers 22%
41% Jeeps
2%
Autoricksha
ws
11%
5.28 Requirements of different road users may differ according to circumstances and observance
of traffic rules and consideration
Kerala State Road Transport Corporation
5.29 Kerala State Road Transport Corporation (KSRTC) is the largest single public sector undertaking,
which carries out transport operations in the State. The passenger transport operation in Kerala is
mainly carried out by private operators. Inter-State analysis shows that in respect of load factor,
passenger lead and passenger per bus per day, performance of KSRTC is above average.
5.30 Out of 5860 buses of KSRTC 1464 ( 25%) buses are ten or more years old. The age wise
details of KSRTC buses are given in Appendix 5.13. The number of schedules operated as on
31.03.2014 has increased from 4067 to 4754 in 2013-14. The average earning per vehicle on road
per day increases from ` 9197 to ` 9812 during 2013-14. About 11634 lakh passengers travelled in
KSRTC buses during this period. The major indicators showing operational efficiency of KSRTC is
given in Appendix 5.14.
5.31 The average Kms run per bus per day of KSRTC rose from 318.92 Km to 323.38 Km during
2013-14. The average monthly collection of the Corportion has increased from ` 131.08 Crore in
2012-13 to ` 138.29 Crore in 2013-14. During the period, 332 new buses were put on the road. The
District wise operational statistics of KSRTC during 2013-14 is given in Appendix 5.15.
5.32 The fares charged by KSRTC ranged from 58 paise per Km in Ordinary and city buses during
2013-14. The fares of Super fast Buses are 65 paise per Km, 80 paise to super deluxe services,
100 paise for A/C Air Bus and 120 paise for High Tech Volvo Buses. The fare structure of KSRTC
is given in Appendix 5.16.
5.33 Inter Unit analysis of KSRTC reveals that about 30% of the units of the State exhibit poor
performance. The unit wise details of operational statistics are given in Appendix 5.17.
Kerala State Planning Board