According to the Census of India 2011, the population of Kerala was 33,406,061, or 2.76 per cent of India’s population. Of the States total population, 48 per cent population are males and 52 per cent are females.
The decadal growth rate of Kerala’s population was 4.9 per cent, the lowest among Indian States. Among the districts of the State, Malappuram has the highest growth rate (13.4 per cent), and Pathanamthitta has the lowest growth rate (-3.0 per cent). Idukki also has a negative growth rate (-1.8 per cent). The growth rate of population is lower in six southern districts (Idukki, Kottayam, Alappuzha, Kollam, Pathanamthitta and Thiruvananthapuram) than in other districts of the State.
Child Population
The child population (0-6 years) in Kerala shows a declining trend. Census data shows an absolute decline in the child population in the State. Kerala’s total child population in 2011 was 3,472,955 and 3,793,146 in 2001 census data. The population of children in the age group 0-6 years in Kerala was 12 per cent at the Census of 2001 and 10 per cent at the Census of 2011(The corresponding figure for India in 2011 was 13 per cent). Figure 1.1 presents a picture of child population in the districts of Kerala in 2001 and 2011. The highest proportion of child population was in Malappuram district and lowest proportion was in Pathanamthitta district. The decreasing trend is seen in all districts of the State. The southern districts of Kerala show 2 per cent decline except Kollam which has a decline of 1 per cent in the proportion of child population, while the northern districts in Kerala show 1 per cent decline in the proportion of child population except Wayanad which has a decline of 2 per cent. It shows that new addition to population in northern districts is faster than in the southern districts. Details are given in Appendix 1.1
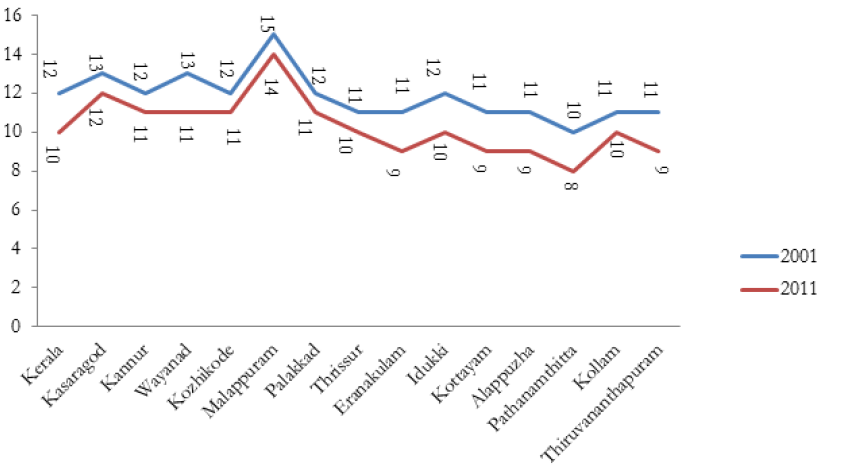 Source: Census 2001, 2011
The share of urban population in Kerala was 47.7 per cent, representing a decadal increase of 21.74 per cent between 2001 and 2011. As many as 15,934,926 persons in the State were living in urban areas. The rural population was 17,471,135. The district in which the proportion of the urban to total population was highest is Ernakula(68 per cent). The share of urban population is lowest in Wayanad (3.9 per cent).
Literacy
Kerala has the highest proportion of literate persons in the population among Indian States. The effective literacy rate is 93.91 per cent. Literacy was 90 per cent at the Census of 2001. The national literacy rate is 72 per cent. Among districts, Kottayam tops in the literacy chart with 97.2 per cent and Pathanamthitta is just behind with 96.5 per cent. Wayanad has the lowest literacy rate of 89 per cent and Palakkad is just above with 89.3 per cent. Even the lowest literacy rate of Wayanad (89 per cent) is higher than national rate of literacy. All districts have a score above 90 except Palakkad (89.3) and Wayanad (89). The difference between the lowest and the highest value is just 8.2. As compared to 2001, literacy rate of all the districts has improved. Details are given in Appendix 1.1.
Sex Ratio
The sex ratio (number of females per thousand males) of Kerala according to Census 2011 is 1084 and has improved by 26 points from 2001. The sex ratio of Kerala was 1022 in 1961 and increased to 1016 in 1971. It further increased to 1032 and 1036 in 1981 and 1991 respectively. Sex ratio of Tamil Nadu is 996, of Karnataka is 973, of Andhra Pradesh is 993 and that of India is 943.
Among the districts, Kannur has the highest sex ratio (1136) followed by Pathanamthitta (1132). While Idukki has the lowest ratio (1006), Ernakulum is just above with 1027. All the districts have sex ratio above 1000. In 2001, only Wayanad had ratio below 1000 (994). The difference between the lowest (Idukki, 1006) and highest (Kannur, 1136) is 130 points. Details are given in Appendix 1.2.
Child Sex Ratio (0-6 Years)
Child sex ratio in Kerala is 964 as per the 2011 census data. It was 960 in 2001. The child sex ratio in Tamil Nadu is 943, Karnataka 948, Andhra Pradesh 939 and the national figure is 919. Among districts, Pathanamthitta has the highest ratio (976) followed by Kollam (973) and Kannur (971). Thrissur has the lowest ratio (950), and Alappuzha is just above with a ratio of 951. The difference between lowest and highest is 26 points. All districts have a ratio below 1,000. When analysing the decadal change, the highest increase is in Kollam (13) followed by Kozhikode (10). The decadal change in other districts is below 10. Thrissur (-)8, Idukki (-)5 and Alappuzha (-)5 have negative decadal change in child sex ratio. Details are in Appendix 1.2.
Density of Population
Kerala’s density of population as per 2011 census is 860 persons per sq. km. While density of population in Tamil Nadu is 555, Karnataka 319, Andhra Pradesh 308, and that of India is 382. Thiruvananthapuram is the most densely populated district (1,508) while, Idukki is the least densely populated district (255). Density of population increased in all districts between the Censuses of 2001 and 2011, other than in Pathanamthitta and Idukki. Details are in Appendix 1.1.
District-Wise Distribution of Population
The details of District-wise population in the State are in Table 1.1.
| Unit | 1981 | 1991 | 2001 | 2011 |
| Kerala | 100.0 | 100.0 | 100.0 | 100.0 |
| Kasaragod | 3.4 | 3.7 | 3.8 | 3.9 |
| Kannur | 7.6 | 7.7 | 7.6 | 7.6 |
| Wayanad | 2.2 | 2.3 | 2.5 | 2.4 |
| Kozhikode | 8.8 | 9.0 | 9.0 | 9.2 |
| Malappuram | 9.4 | 10.6 | 11.4 | 12.3 |
| Palakkad | 8.0 | 8.2 | 8.2 | 8.4 |
| Thrissur | 9.6 | 9.4 | 9.3 | 9.3 |
| Ernakulam | 10.0 | 9.7 | 9.8 | 9.8 |
| Idukki | 3.8 | 3.7 | 3.5 | 3.3 |
| Kottayam | 6.7 | 6.3 | 6.1 | 5.9 |
| Alappuzha | 7.3 | 6.9 | 6.6 | 6.4 |
| Pathanamthitta | 4.4 | 4.1 | 3.9 | 3.6 |
| Kollam | 8.5 | 8.3 | 8.1 | 7.9 |
| Thiruvananthapuram | 10.2 | 10.1 | 10.2 | 9.9 |
| Source: Census 1981,1991,2001,2011 | ||||
Analysis of district-wise distribution of State population for the last 40 years from 1981 to 2011 shows that Malappuram district continues to hold largest share of State population followed by Thiruvananthapuram and Ernakulam. Wayanad continues to have the smallest share of State population. Idukki, Kasragode and Pathanamthitta also have a lower share of State population.
Age Group Distribution
It is interesting to note the demographic transition in Kerala during the last fifty years. It is observed that the proportion of population in the age group of (0-14 years), has declined from 43 per cent in 1961 to 23 per cent in 2011. In the case of working age group (15-59 years), the population is increasing but at a lower rate. However, due to the increasing life expectancy and availability of health facilities, the proportion of population in the old age group (60 years and above) is showing an increasing trend from 6 per cent in 1961 to 13 per cent in 2011 (Figure 1.2).
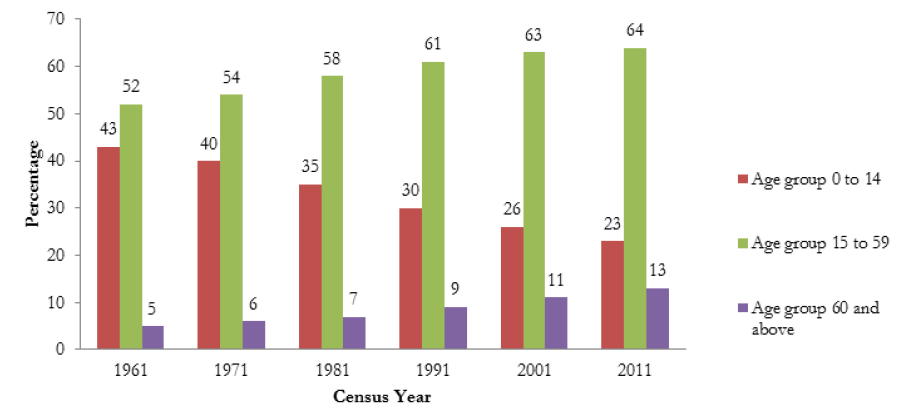
Source: Census 1961,1971,1981,1991,2001,2011
If the trend continues like this, in the near future, the addition to the working age group (15-59) will decrease as the feeder category (0-14) is diminishing. Moreover, proportion of the old age dependent group (60 and above) will increase which will entail higher social security expenditure by government.
Urbanisation
The decadal growth rate of Kerala has been declining since 1981 at a greater pace than the national level. The decadal growth rate of Kerala during 2001-2011 has registered the lowest growth of 4.9 per cent ever since independence. It is much lower than the decadal growth rate of the nation as a whole which is 17.64 per cent. The gap between the rate of growth of population for India and Kerala has been increasing since 1981. The State’s addition to the total population of the country constitutes only 0.83 per cent of the national population growth of 181 million during 2001-2011.
The decadal growth rate of rural population has also been declining since 1971 except for the year 2001. This trend is largely related to the unique settlement pattern of the State. Unlike the other parts of India, the habitation of the State is spread continuously without much open lands or fields separating habitations. A rural area is clearly visible elsewhere in India which mainly consists of vast areas of agricultural land with hamlets distributed sporadically. However, in Kerala, a number of small and medium towns are distributed in the village background.
In the first Census of 20th century (1901), the State had a population of 6.4 million of which 5.9 million (92.9 per cent) were living in rural areas. The urban population accounted for only half a million, estimated as less than 10 per cent of the total population of the State. Over a period of hundred years, the share of rural population has undergone a steady decline and was 74 per cent of total population in 2001. Significantly, in 2011 census, the population of the State was almost equally divided between rural and urban areas. The State has now an urban population of 159 million which accounts for 47.7 per cent of total population against a rural population of 174 million (52.3 per cent). The decadal growth rate of the urban population is 92.72 per cent in 2011.
It is evident that there is a large increase in the number of towns due to the increase in number of census towns in 2011. A census town is defined as one area which is not statutorily notified as town but has attained urban characteristics in number of population which exceeds 5,000; density of population is at least 400 persons per sq. km; and a minimum of 75 percentage of male working population is employed outside the agricultural sector. As per Census 2011, there are 461 census towns and 59 statutory towns in Kerala as against 99 and 60 respectively in census 2001 which shows a 366 per cent growth in the number of census towns. This classification of census towns has brought the rural population growth to negative figures. Furthermore, the decadal population growth rate of the towns which existed in both 2001 and 2011 census is estimated to be 3.90 per cent, lower than that of the State’s average of 4.86 per cent decadal population growth rate. This negates the scope of migration to the towns as an attribute of urban population growth. The growth in urban population is largely due to the increase in census towns that led to the urban sprawl in the State.
The highest number of towns falls in Thrissur district with 135, which accounts for more than 25 per cent of total towns in the State. Around 60 percentage of towns are located in Thrissur, Kannur, Ernakulam and Kozhikode districts. Urban population has crossed 1 million in 8 districts. Of these, Ernakulam has got the highest urban population, closely followed by Thrissur, Kozhikode and Malappuram districts. The total urban population of these four districts together constitutes more than 50 percentage of urban population in the State. Wayanad and Idukki districts do not have any census towns in 2011, except one statutory town each. Wayanad is the district with least urban population in the State. Considering the urban population growth index during 2001-2011, the index increased in all districts except Idukki. Malappuram district shows significant increase in urban population growth index followed by Kollam, Thrissur and Kasaragod. Wayanad has the least index value.
In terms of share of rural population to the total population of the State, Malappuram and Palakkad together account for 25 per cent. Along with the above districts, Kasargod, Kottayam, Pathanamthitta, Kollam, Idukki and Wayanad are the other districts where rural population outnumber the urban population. In Idukki and Wayanad, rural population exceeds 95 per cent of the population of the districts.
The overall sex ratio of the State is 1084 female for 1000 male. Sex ratio of rural area is 1077 and urban area is 1091. A notable change in sex ratio of 2001 and 2011 census is that the number of males predominated in Wayanad district and rural areas of Idukki district in 2001 census. Now in 2011 the position has entirely changed in favour of female in all districts irrespective of rural and urban divide. As far as the number of children in the age group 0-6, there is a huge fall in the absolute number by 470,899 which is a positive indicator of fall in fertility and future growth of population. The rural-urban sex-wise break up of child population shows negligible variation.