Trend in Prices – All India
Inflation in India, both in terms of CPI-combined (CPI-C) and Wholesale Price Index (WPI) has decreased in recent years. The main trends in inflation during the last few years include secular decline in headline inflation; convergence of CPI and WPI; decline in inflation across commodity groups, notable being food; narrowing of gap between rural and urban inflation; and decline in inflation across State. The general inflation based on different indices in India is shown in Table 1.12.
| Index | 2012-13 | 2013-14 | 2014-15 | 2015-16 | 2016-17 |
| Wholesale Price Index | 6.9 | 5.2 | 1.2 | -3.7 | 1.7 |
| Consumer Price Index (Combined) | 10.2 | 9.5 | 5.9 | 4.9 | 4..5 |
| Consumer Price Index (Industrial Workers) | 10.4 | 9.7 | 6.3 | 5.6 | 4.1 |
| Consumer Price Index (Agricultural Labourers) | 10.0 | 11.6 | 6.6 | 4.4 | 4.2 |
| Consumer Price Index (Rural Labourers) | 10.2 | 11.5 | 6.9 | 4.6 | 4.2 |
| Source: Economic Survey 2016-17, Volume 2, Ministry of Finance, Government of India | |||||
The annual average inflation rate of WPI of all commodities in 2016-17 was 1.7 per cent against (-)3.7 per cent in 2015-16 (Base year 2011-12). Price of primary articles, fuel and power and manufactured products has increased in 2016-17. On the other hand, Consumer Price index (combined) inflation (Base 2012) for 2015-16 declined to 4.9 per cent from 5.9 per cent in 2014-15. Food inflation based on Consumer Food Price Index (CFPI) declined to 4.9 per cent in 2015-16 from 6.4 per cent in 2014-15. It averaged 5.1 per cent in 2016-17 (April to December) and dropped to 1.4 per cent in December 2016. As per the revised Monetary Policy Framework, the Government has fixed the inflation target of 4 per cent with tolerance level of above or below 2 per cent for the period beginning from August 5, 2016 to March 31, 2021.
The annual rate of inflation, based on monthly Wholesale Price Index (WPI) (Base 2011-12) stood at 3.59 per cent (provisional) for the month of October, 2017 (over October, 2016) as compared to 2.60 per cent (provisional) for the previous month and 1.27 per cent during the corresponding month of the previous year. Build up inflation rate in the financial year so far was 2.03 per cent compared to a build up rate of 3.53 per cent in the corresponding period of the previous year.
The all India inflation rate based on Consumer Price Index (Rural, Urban and Combined, Base 2012) for the month of October 2017 (provisional) as compared to October 2016 is 3.36, 3.81 and 3.58 per cent respectively. The corresponding Consumer Food Price Index for all India Rural, Urban and Combined for the month of October is 1.75, 2.13 and 1.90 respectively.
Trend in prices-Kerala
Wholesale Price Index (WPI)
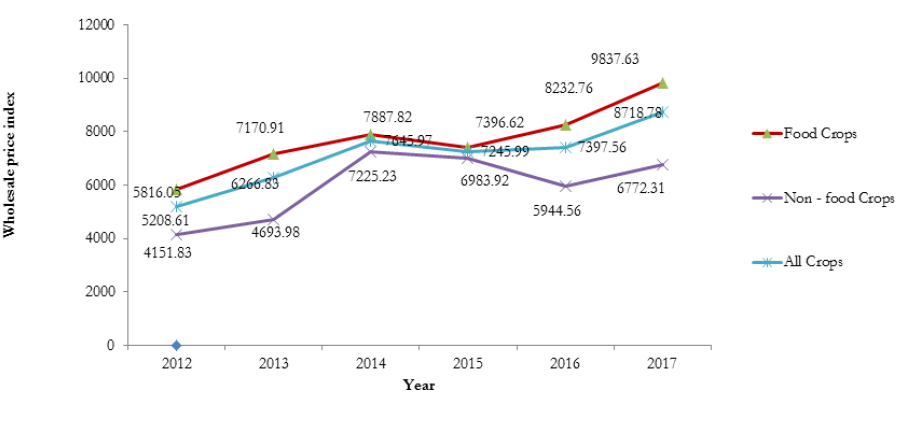
Wholesale Price Index in Kerala has increased for both food and non-food crops. WPI of food crops has increased to 9,837.63 in August 2017 from 8,033.23 in August 2016. Since 2012, WPI of food crops has exhibited an increasing trend. Among food crops, price of rice and fruits and vegetables has increased by 20.5 per cent and 28.9 per cent respectively. WPI of the non-food crops has increased to 6,772.31 in August 2017 from 5,841.01 in August 2016. Wholesale Price index of oil and oil seeds increased from 6,691.80 in August 2016 to 7,919.75 in August 2017, showing a percentage variation of 18.4 per cent. Altogether, WPI of all crops including food and non-food crops has increased sharply in August 2017 over the previous years. The WPI in 2016 (up to August) was 7,233.07. The index has increased to 8718.78 as of August 2017. About 20.5 per cent hike has been registered in August 2017 over the same period of previous year. Wholesale Price index of all crops during the period from 2012 to 2017 is given in Appendix 1.33 and Figure 1.12

Month wise Wholesale Price Index of Agricultural Commodities in Kerala reveals that there was an increase in index for non-food crops and a decline in index for food crops in August 2017 from July 2017. The index for rice, fruits and vegetables, condiments and spices registered a decline in August 2017 as compared to July 2017 while the index for molasses and oilseeds registered an increase during the corresponding period. However, compared to January 2017, index of most of the commodities registered an increase in August 2017 except fruits and vegetables and plantation crops. A detailed month wise Wholesale Price Index of agricultural commodities for 2016 and 2017 (upto August) is summarised in Appendix 1.34.
Consumer Price Index (CPI)
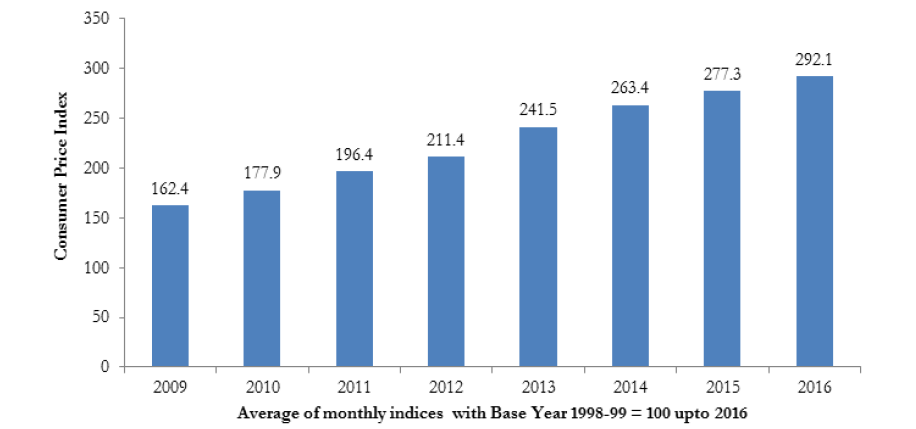
The annual average Consumer Price Index (Base 1998-99=100)in Kerala was estimated at 292.1 in 2016 against 277.3 in 2015. The percentage variation in 2016 over 2015 was 5.325 per cent.The base year of CPI has been modified to 2011-12=100 and data from 2016 is available with the new base. The CPI in 2016 with new base year is 143.29 while the CPI in 2017 (up to July 2017) is 149.34.
Centre-wise analysis of CPI indicates that, during 2017, Pathanamthitta district had highest CPI of 156.86 against 152 in the year of 2016 followed by Kannur (155.14) and Chalakkudi (153.57). While analysing the trend of inflation in Kerala during 2017, the highest rate of inflation was experienced in Malappuram (5.27 per cent) followed by Ernakulam (5.10 per cent) and Kottayam (5.06 per cent). The percentage variation was lowest in Kasaragode (2.8 per cent). The centre-wise Annual Average Consumer Price Index and percentage of variation is shown in Appendix 1.35. The annual average Consumer price Index number from 2009 to 2016 (Base Year 1998-99=100) is shown in Figure 1.13.

Retail Prices
Price of essential commodities have been showing a rising trend during 2017. The price of 1 kg rice (Matta) in January 2017 was 37.82 and it increased to 44.02 in September 2017, an increase of 16 per cent. Price of various brands of coconut oil increased between 27 per cent to 44 per cent between January 2017 to September 2017. Price per Coconut has increased to 20 in September 2017 from 15 in January 2017. Price fluctuation was observed in case of fruits and vegetables. Price of big onion per kg in January 2017 was 18.43. However, after a decline in prices in February, it started increasing from June and reached to 33 in August 2017. Price of per kg small onion increased by 245 per cent from 33 in January 2017 to 114 in June 2017 and thereafter decreased to 97.95 in September 2017. Monthly State average retail prices of essential commodities from January 2017 to September 2017 is given in Appendix 1.36.
Price Parity
The parity index has been estimated at 59.83 in 2016 lower than the index in 2014 and 2015. The value in 2014 and 2015 were 72.08 and 63 respectively. In 2015, the index of farm cultivation cost increased from 2014, whereas the index of prices received by farmers decreased during that period. Cost of farm input, fertilizer, transportation cost, wage of labour have increased whereas there has not been a commensurate growth in farm income. During 2016, index of price received by farmers was (income) 7730.75 and their index of the farm expenses was 12936.25. During 2017 (as of May) price index of income of the farmers has increased only to 8887.6 against the farm expenses of 13323.20 and the parity was 66.6. The Yearly Average Index Number of Prices received and price paid by farmers is shown in Appendix 1.37.
Wages
Average Daily Wage Rates of skilled workers in the agriculture sector has increased in 2016-17 over the previous years. Daily wage rates of Carpenter and Mason have increased to 792.83 and 789.50 from 746.17 and 753.08 in 2015-16 respectively. In terms of percentage, the daily wage rate of carpenter has increased by 6.2 per cent in 2016-17 and that of mason has increased by 4.81 per cent in 2016-17. The average daily wage rate of skilled workers in agriculture sector from 2005-06 to 2016-17 is given in Appendix 1.38.
The wage rate of unskilled workers in the unorganised sectors both male and female has increased to 608.29 (3.7 per cent increase) and 447.85 (6.07 per cent increase) in 2016-17. Even though wage rate has increased since 2005-06, female paddy field workers are getting low wages as compared to their male workers. The average daily wage rates of unskilled workers in agriculture sector from 2005-06 to 2016-17 is given in Appendix 1.39.
Price Control Mechanism
State and Central governments monitor price situation on a regular basis and have taken measures to control inflation. State Government has built up effective Public Distribution System, Horti crop shops, Consumer fed, Supplyco, etc. for distributing essential commodities at the subsidised rate to the people. State Government also imported rice from Andhra Pradesh to meet the scarcity of rice in domestic market and supplied it at affordable price. Government of India also took measures such as creating buffer stock of pulses through domestic procurement and imports, reducing import duty on potatoes, wheat and palm oil; and allowing duty free import of 500,000 tonnes of raw sugar to enhance domestic availability to contain inflation.