National Income
The Central Statistics Office (CSO), Ministry of Statistics and Programme Implementation, has released the provisional estimates of National Income for the financial year 2016-17 both at constant (2011-12) and current prices. The Gross National Income (GNI) at 2011-12 prices is estimated at 120.35 lakh crore in 2016-17, as against the previous year's estimate of 112.46 lakh crore. In terms of growth rates, the gross national income is estimated to have risen by 7.0 per cent during 2016-17, in comparison to the growth rate of 8.0 per cent in 2015-16. The GNI at current prices is estimated at 149.94 lakh crore in 2016-17, as compared to 135.22 lakh crore in 2015-16, showing a rise of 10.9 per cent. The Net National Income (NNI) at current prices is estimated at 134.08 lakh crore in 2016-17, as compared to 120.76 lakh crore in 2015-16, showing a increase of 11.0 per cent. Details are given in Table 1.2.
| Sl. No | Item | At 2011-12 Prices | At Current Prices | ||||
| 2014-15 (NS) | 2015-16 (NS) | 2016-17 (PE) | 2014-15 (NS) | 2015-16 (NS) | 2016-17 (PE) | ||
| 1 | GVA at basic prices | 9719023 | 10490514 (7.9) | 11185440 (6.6) | 11481794 | 12458642 (8.5) | 13669914(9.7) |
| 2 | Gross National Income (GNI) | 10412280 | 11246305 (8.0) | 12034713 (7.0) | 12297698 | 13522256 (10.0) | 14994109 (10.9) |
| 3 | Net National Income (NNI) | 9231556 | 9982112 (8.1) | 10686776 (7.1) | 10953761 | 12076882 (10.3) | 13408211 (11.0) |
| 4 | Gross domestic product (GDP) | 10536984 | 11381002 (8.0) | 12189854 (7.1) | 12445128 | 13682035 (9.9) | 15183709 (11.0) |
| 5 | Net domestic product (NDP) | 9356260 | 10116809 (8.1) | 10841917 (7.2) | 11101191 | 12236662 (10.2) | 13597811 (11.1) |
| 6 | Per capita Gross domestic product () | 83165 | 88706 (6.7) | 93840 (5.8) | 98225 | 106641 (8.6) | 116888 (9.6) |
| 7 | Per capita Net domestic product () | 73846 | 78853 (6.7) | 83464 (5.8) | 87618 | 95375 (8.8) | 104679 (9.7) |
Note: The figures in parenthesis show the percentage change over previous year.
NS- New Series Estimate, PE- Provisional Estimate.
Source: Central Statistics Office. |
|||||||
Real Gross Value Added (GVA) at basic constant (2011-12) prices for the year 2016-17 is estimated at 111.85 lakh crore showing a growth rate of 6.6 per cent over the GVA for the year 2015-16 of 104.91 lakh crore. The GVA at current prices is estimated at 136.69 lakh crore during 2016-17, as compared to 124.58 lakh crore during 2015-16, showing a increase of 9.7 per cent.
GDP at constant (2011-12) prices for the year 2016-17 is estimated at 121.90 lakh crore showing a growth rate of 7.1 per cent over the year 2015-16 of 113.81 lakh crore. GDP at current prices in the year 2016-17 is estimated at 151.84 lakh crore, showing a growth rate of 11.0 per cent over the estimates of GDP for the year 2015-16 of 136.82 lakh crore. The per capita GDP in real terms (at 2011-12 prices) during 2016-17 is estimated at 93,840 as against 88,706 in 2015-16, registering an increase of over 5.8 per cent during the year. The per capita GDP at current prices is estimated at 116,888 in 2016-17 as against 106,641 for the previous year showing a growth of 9.6 per cent.
There are some conceptual differences between the key aggregates of national accounts published till 2014-15 at 2004-05 base year prices and 2011-12 base year prices being published now. Base year has been revised in the computation of national accounts statistics from 2004-05 to 2011-12. Some concepts have also undergone changes following the adoption of System of National Accounts (2008). GDP at factor cost has been replaced by Gross Value Added (GVA) at basic prices and GDP at market prices is now termed GDP.
The details of GDP, NDP, GNI and NNI at current and constant (2011-12) prices from 2012-13 to 2016-17 with percentage change over previous year are given in Appendix 1.3, 1.4, 1.5 and 1.6. The sectoral distribution of GVA at basic price at constant (2011-12) prices and current prices with percentage change over previous year is given in Appendix 1.7 and Appendix 1.8
State Income
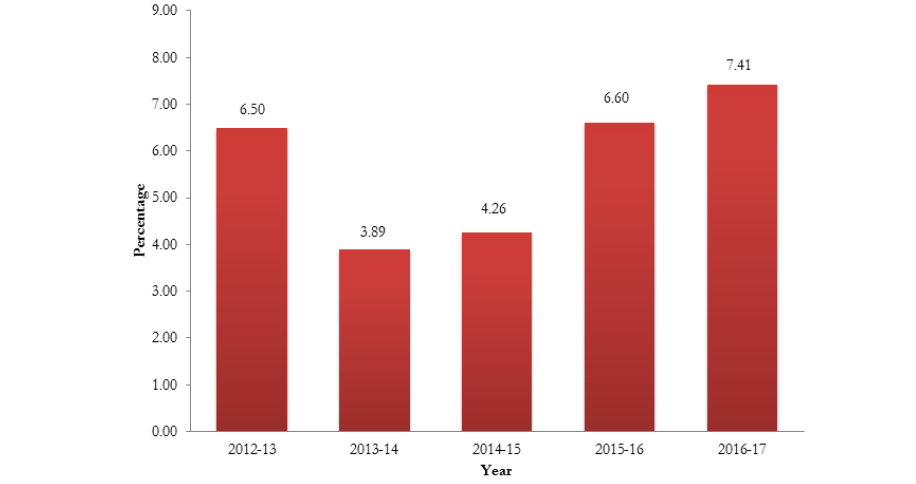
The quick estimate of Gross State Domestic Product (GSDP) at constant (2011-12) prices is 48,087,791 lakh during 2016-17 as against the provisional estimate of 44,769,237 lakh during 2015-16, registering a growth rate of 7.41 per cent in 2016-17 compared to 6.60 per cent in 2015-16 (Figure 1.3). At current prices the Gross State Domestic Product is estimated at 61,703,466 lakh (quick estimate) in 2016-17 as against the provisional estimate of 55,794,651 lakh during 2015-16 showing a growth rate of 10.59 per cent.
 Source : Department of Economics and Statistics
The quick estimate of Net State Domestic Product (NSDP) at factor cost at constant prices (2011-12) is 44,051,533 lakh in 2016-17 compared to the provisional estimate of 40,906,975 lakh during 2015-16, recording a growth rate of 7.69 per cent in 2016-17. At current prices the NSDP is estimated at 55,848,205 lakh (quick estimate) in 2016-17 compared to the provisional estimate of 50,392,861 lakh during 2015-16. The growth rate of NSDP at current prices is 10.83 per cent in 2016-17 compared to 9.40 per cent in 2015-16 (Table 1.3).
| Sl. No | Item | Income (Lakh) | Growth Rate (in per cent) |
|||
| 2014-15 | 2015-16 (P) | 2016-17 (Q) | 2015-16 (P) | 2016-17 (Q) | ||
| 1 | Gross State Domestic Product | |||||
| a) At Constant (2011-12) Prices | 41,995,555 | 44,769,237 | 48,087,791 | 6.60 | 7.41 | |
| b) At Current Prices | 51,256,405 | 55,794,651 | 61,703,466 | 8.85 | 10.59 | |
| 2 | Net State Domestic Product | |||||
| a) At Constant (2011-12) Prices | 38,213,426 | 40,906,975 | 44,051,533 | 7.05 | 7.69 | |
| b) At CurrentPrices | 46,061,432 | 50,392,861 | 55,848,205 | 9.40 | 10.83 | |
| 3 | Per Capita GSDP () | |||||
| a) At Constant (2011-12) Prices | 123,573 | 131,086 | 140,107 | 6.08 | 6.88 | |
| b) At Current Prices | 150,824 | 163,369 | 179,778 | 8.32 | 10.04 | |
| 4 | Per Capita NSDP () | |||||
| a) At Constant (2011-12) Prices | 112,444 | 119,777 | 128,347 | 6.52 | 7.15 | |
| b) At Current Prices | 135,537 | 147,552 | 162,718 | 8.86 | 10.28 | |
| Source: Department of Economics and Statistics P: Provisional Estimate, Q: Quick Estimate | ||||||
Per Capita State Income
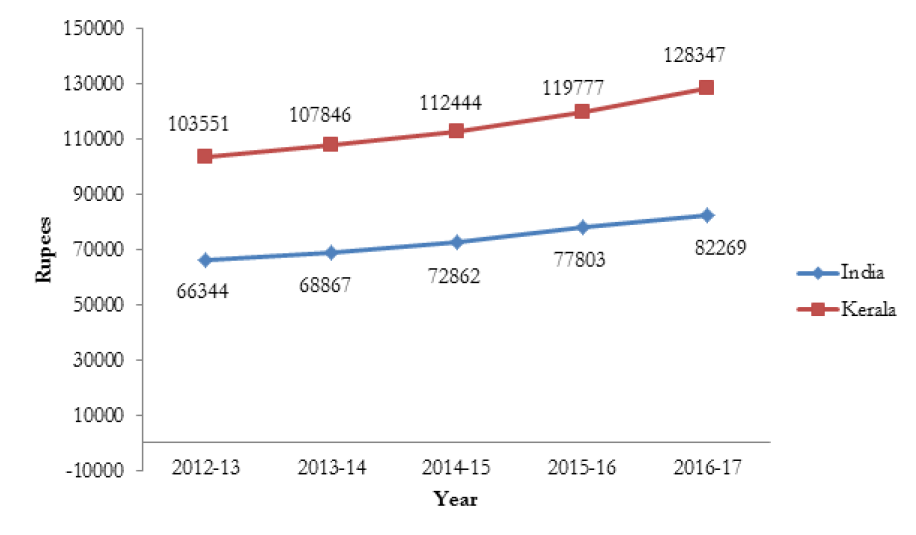
As per the quick estimates, the per capita GSDP at constant (2011-12) prices in 2016-17 was 140,107 as against the provisional estimate of 131,086 in 2015-16, recording a growth rate of 6.88 per cent in 2016-17. At current prices, the per capita GSDP in 2016-17 was 179,778 registering a growth rate of 10.04 per cent over the previous year’s estimate of 163,369. The best indicator of per capita State income is NSDP divided by the population. At constant (2011-12) prices, the quick estimates of per capita NSDP in 2016-17 was 128,347 as against provisional estimate of 119,777 in 2015-16, recording a growth rate of 7.15 per cent in 2016-17. Figure 1.4 shows that during the period 2012-13 to 2016-17, the per capita State income at constant prices was higher than the per capita national income.
 Source: Central Statistics Office and Department of Economics and Statistics.
Sectoral Distribution of Gross State Value Added (GSVA)
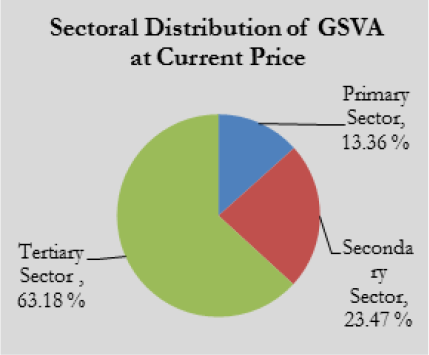
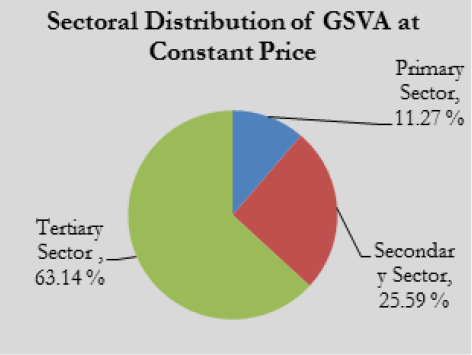
During 2016-17, the contribution from primary, secondary and tertiary sectors to the GSVA at constant prices (2011-12) was 11.27 per cent, 25.59 per cent and 63.14 per cent respectively. At current prices, the primary, secondary and tertiary sectors contributed 13.36 per cent, 23.47 per cent and 63.18 per cent respectively to the GSVA during this period. (Figure 1.5).
 |
 |
The contribution to GSVA (at current prices) of the tertiary sector and primary sector increased from 62.59 per cent in 2015-16 to 63.18 per cent in 2016-17, and from 12.82 per cent in 2015-16 to 13.36 per cent in 2016-17 respectively. During the corresponding period the contribution of secondary sector declined from 24.59 per cent to 23.47 per cent.
The analysis of annual sectoral growth rate of GSDP shows that tertiary sector recorded the highest rate of growth of 6.7 per cent in 2016-17 at constant (2011-12) prices followed by primary sector (5.19 per cent) and tertiary sector 2.88 per cent. During the period, the growth rate in primary sector increased from -11.2 per cent to 5.19 mainly because of the increase in production of some of the crops, live stocks, fishing and aquaculture and mining and quarrying.
At current prices, the primary sector recorded a growth rate of 13.25 per cent, tertiary sector 9.72 per cent and secondary sector 3.74 per cent in 2016-17. The driving force for the growth of the tertiary sector is mainly the growth in the Transport, storage, communication and service related broadcasting and public administration.
During the period 2013-14 to 2015-16, the share of contribution of tertiary sector has increased from 60.43 to 63.66 per cent. However, the share of primary sector decreased from 13.45 per cent to 12.07 per cent and secondary sector also decreased from 25.81 to 24.27 per cent during this period. The details of sectoral distribution of GSDP with percentage share during the last three years is given in Appendix 1.9, 1.10 and 1.11 and the details of GSDP, NSDP at constant and current prices during 2011-12 to 2015-16 are given at Appendix 1.12, 1.13, 1.14 and 1.15.
District-wise Gross State Domestic Product
District-wise distribution of GSVA at basic price at current prices shows that Ernakulam District continues to have the highest income of 6,918,835 lakh in 2016-17 as against 6,296,547 lakh in 2015-16 registering a growth rate of 9.88 per cent. At constant (2011-12) prices, this amounts to 5,491,752 lakh in 2016-17 compared to 5,125,647 lakh in 2015-16. The district wise GSVA details are given in Table 1.4.
| Sl. No | District Name | Gross State Value Added at Basic Price ( in lakh) | |||||
| At Current Prices | At Constant Prices (2011-12) | ||||||
| 2015-16 (P) | 2016-17 (Q) | Growth Rate (%) | 2015-16 (P) | 2016-17 (Q) | Growth Rate (%) | ||
| 1 | Thiruvananthapuram | 5,119,355 | 5,567,163 | 8.75 | 4,087,733 | 4,311,759 | 5.48 |
| 2 | Kollam | 4,568,252 | 4,980,196 | 9.02 | 3,622,737 | 3,825,637 | 5.60 |
| 3 | Pathanamthitta | 1,438,255 | 1,599,967 | 11.24 | 1,135,630 | 1,218,492 | 7.30 |
| 4 | Alappuzha | 3,650,842 | 3,959,161 | 8.45 | 2,922,450 | 3,069,069 | 5.02 |
| 5 | Kottayam | 3,021,186 | 3,273,951 | 8.37 | 2,504,602 | 2,627,009 | 4.89 |
| 6 | Idukki | 1,895,868 | 2,056,010 | 8.45 | 1,453,150 | 1,485,762 | 2.24 |
| 7 | Ernakulam | 6,296,547 | 6,918,835 | 9.88 | 5,125,647 | 5,491,752 | 7.14 |
| 8 | Thrissur | 5,178,400 | 5,561,292 | 7.39 | 4,144,093 | 4,343,482 | 4.81 |
| 9 | Palakkad | 3,717,274 | 3,998,133 | 7.56 | 2,904,804 | 3,034,377 | 4.46 |
| 10 | Malappuram | 4,896,021 | 5,363,418 | 9.55 | 3,889,842 | 4,144,456 | 6.55 |
| 11 | Kozhikode | 4,395,664 | 4,681,302 | 6.50 | 3,491,034 | 3,633,201 | 4.07 |
| 12 | Wayanad | 1,029,524 | 1,107,058 | 7.53 | 770,726 | 802,474 | 4.12 |
| 13 | Kannur | 3,509,232 | 3,866,359 | 10.18 | 2,823,432 | 3,027,512 | 7.23 |
| 14 | Kasaragod | 1,718,063 | 1,889,926 | 10.00 | 1,359,393 | 1,443,907 | 6.22 |
| GSVA | 50,434,483 | 54,822,771 | 8.70 | 40,235,273 | 42,458,889 | 5.53 | |
| Source: Department of Economics and Statistics, (P: Provisional Q:Quick) | |||||||
District-Wise Per Capita Income
The analysis of district-wise per capita reveals that Ernakulam district continues to stands first with the per capita income of 162,297 at constant (2011-12) prices in 2016-17 as against 152,318 in 2015-16. The district wise per capita income with corresponding rank and growth rate is given in Table 1.5.
Table 1.5 reveals that Thiruvananthapuram, Kollam, Pathanamthitta, Ernkulam, Kannur, Kasargod, Malappuram, had a higher growth than the State average growth rate in per capita income in 2016-17. However, the districts of Alappuzha, Kottayam, Idukki, Thrissur, Palakkad, and Wayanad districts showed lower growth than the State average growth rate in per capita income. District wise and sectoral distribution of GSVA from 2014-15 to 2016-17 at current and constant (2011-12) prices are given in Appendix 1.16, 1.17, 1.18, 1.19, 1.20 and 1.21.
| Sl. No. | District | 2015-16 (P) |
Rank | 2016-17 (Q) |
Rank | Growth Rate (%) |
| 1 | Thiruvananthapuram | 122,679 | 7 | 129,137 | 7 | 5.26 |
| 2 | Kollam | 136,282 | 3 | 143,638 | 2 | 5.40 |
| 3 | Pathanamthitta | 96,134 | 12 | 103,460 | 12 | 7.62 |
| 4 | Alappuzha | 136,804 | 2 | 143,542 | 3 | 4.92 |
| 5 | Kottayam | 126,238 | 6 | 132,267 | 6 | 4.78 |
| 6 | Idukki | 132,107 | 4 | 135,316 | 5 | 2.43 |
| 7 | Ernakulam | 152,318 | 1 | 162,297 | 1 | 6.55 |
| 8 | Thrissur | 129,922 | 5 | 135,518 | 4 | 4.31 |
| 9 | Palakkad | 100,128 | 10 | 103,855 | 11 | 3.72 |
| 10 | Malappuram | 89,357 | 14 | 94,012 | 14 | 5.21 |
| 11 | Kozhikode | 109,632 | 8 | 113,307 | 9 | 3.35 |
| 12 | Wayanad | 92,353 | 13 | 95,715 | 13 | 3.64 |
| 13 | Kannur | 109,602 | 9 | 116,982 | 8 | 6.73 |
| 14 | Kasaragod | 100,198 | 11 | 105,555 | 10 | 5.35 |
| Kerala | 117,811 | 123,707 | 5.01 |