A strong and robust manufacturing sector helps in promoting domestic production, exports and employment growth, all of which can be catalysts for a higher level of development. As per the provisional data from the Central Statistics Office, overall growth of gross value added (GVA) in India for 2016-17 is estimated at 6.6 per cent, and industrial sector growth has declined from 8.8 per cent in 2015-16 to 5.6 per cent in 2016-17 (Table 3.1.2). This is against the background of an overall decelerated global economic activity.
| Sl. No | Sub Sector | 2015-16 | 2016-17 |
| 1 | Mining and quarrying | 10.5 | 1.8 |
| 2 | Manufacturing | 10.8 | 7.9 |
| 3 | Electricity, gas, water supply and other utility services | 5.0 | 7.2 |
| 4 | Construction | 5.0 | 1.7 |
| Industry, Total | 8.8 | 5.6 | |
| Source: Economic Survey 2016-17 | |||
As per the quick estimates of Kerala’s Gross State Domestic Product (GSDP) for 2016-17 by Department of Economics and Statistics, manufacturing sector in Kerala grew 4.5 per cent at current prices in 2016-17 compared to 9.7 per cent in the previous year. At constant prices (2011-12), the sector registered a growth of 2.2 per cent in 2016-17 as against 12 per cent in 2015-16. The share of manufacturing sector to GSDP at constant and current prices in 2016-17 was 10.2 per cent and 9 per cent respectively. The growth of manufacturing sector from 2012-13 to 2016-17 is given in Appendix 3.1.1.
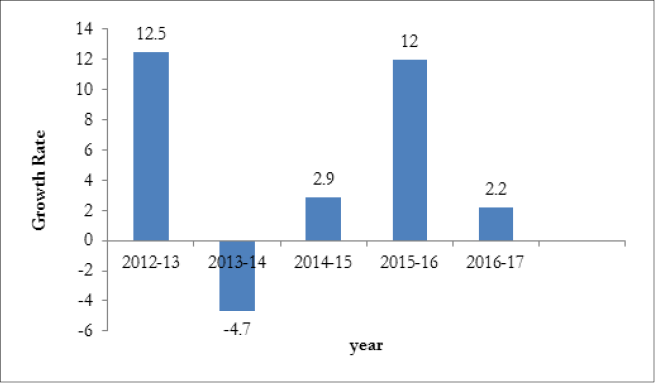
The trend in growth rate of income from manufacturing sector in Kerala on the basis of GSDP at constant prices from 2012-13 to 2016-17 is shown in Figure 3.1.1.
 Source: Directorate of Economics and Statistics
The income from manufacturing sector in Kerala, after registering a 12.5 per cent growth in 2012-13 declined in
2013-14 (-4.6 per cent). In 2014-15, income from manufacturing grew 2.9 per cent, which went up by 12 per cent in 2015-16. It was 2.2 per cent in 2016-17.
The contribution of mining and quarrying sector to GSDP at constant prices is estimated at 2,905 crore in 2016-17, registering a growth of 60.2 per cent over the previous year. The share of mining and quarrying in GSDP at constant prices increased from 0.5 per cent in 2015-16 to 0.7 per cent in 2016-17.
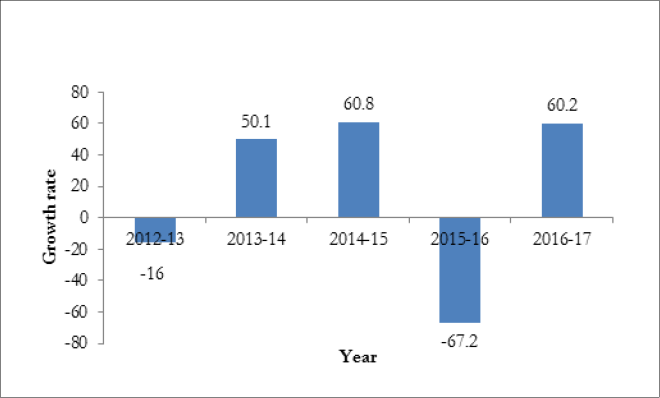
The growth of income from the sector as per estimate of GSDP at constant prices (2011-12) from 2012-13 to 2016-17 is depicted in Figure 3.1.2.
 Source: Department of Economics and Statistics
The income from mining and quarrying sector in Kerala at constant prices was (-)16 per cent in 2012-13, 50.1 per cent in 2013-14, 60.8 per cent in 2014-15, (-)67.2 per cent in 2015-16, and 60.2 per cent in 2016-17.
There were 64 major mineral mines operational in the State as on 31st March 2016. In 2016-17, 64 mining leases for major minerals, 472 quarrying leases for minor minerals, 5,860 quarry permits in minor minerals, and 1,349 dealers’ license were granted. In 2016-17, there were 180 registered metal crusher units in Kerala and the number of prospecting licenses granted for minor minerals was two.
The total area covered by mining leases as on October 2016 is 1,128.9 hectares, of which mineral sand accounts for 558.4 hectares, limestone 245.7 hectares, lime shell/seashell 99.4 hectares, iron ore 86.1 hectares, china clay 70.6 hectares, silica sand 26.5 hectares and quartz 6.8 hectares. Area covered by graphite is 1.3 hectares and of bauxite is nil. Mineral-wise details of area covered by mining lease are given in Appendix 3.1.2.
The Government gets revenue from minerals mainly by way of royalty. About 95 per cent of the revenue comes from minor minerals and rest from major minerals. The total revenue collected in 2016-17 was 138.7 crore.
In 2016-17, Kerala produced 537.3 lakh tonnes of major and minor minerals. Among major minerals, limestone topped the list with 4.1 lakh tonnes followed by ilmenite (1.2 lakh tonnes). Among minor minerals, the highest production was from granite building stone (341 lakh tonnes) followed by ordinary earth (104.6 lakh tonnes).
In 2015-16, revenue from minerals was 119.5 crore, which grew 16 per cent to 138.7 crore in 2016-17. Of this 6.5 crore was received from major minerals and 132.3 crore from minor minerals. In 2016-17, the highest revenue received among major minerals was from lime stone (3.3 crore) followed by ilmenite (1.5 crore). Among minor minerals, granite building stone contributes the highest (81.8 crore) followed by ordinary earth (20.9 crore) and laterite (building) (11.4 crore) in 2016-17. The production of and revenue from minerals in the State in 2016-17 is given in Appendix 3.1.3.
District-wise analysis of revenue collection for the year 2016-17 shows that Ernakulam district had the highest collection of 33.9 crore (24.5 per cent of total revenue) followed by Palakkad 13.4 crore (9.6 per cent) and Thiruvananthapuram 12.4 crore (8.9 per cent). The least revenue collection of 1.8 crore (1.3 per cent) was from Wayanad. The district-wise collection of revenue from major and minor minerals is furnished in Appendix 3.1.4.
The Kerala Online Mining Permit Awarding Services (KOMPAS) is an online system which is implemented through the National Informatics Centre and all modules of the first phase of the project have been developed and implemented in Thiruvananthapuram and Ernakulam districts on a pilot basis from November 2017 onwards.
Kerala is evolving a scientific mining policy, which will include:
Conclusion
Mining and quarrying are important economic activities, although the impact they may have on the environment needs to be closely monitored. The government is therefore diligent in adopting regulations to moderate the negative impacts of mining operations. Modern technologies and practices have, to a great extent, reduced the risks associated with mining and quarrying for the environment and economy.