Chapter 8
LOCAL GOVERNMENTS AND
DECENTRALISED PLANNING IN KERALA
Introduction
The decentralization initiated by the 73rd and 74th amendment Acts of the Indian Constitution has given greater responsibility and powers to the local bodies for local planning, effective implementation and monitoring of various social and economic development programmes. In Kerala, the process of decentralization launched at the beginning of 9th Five Year Plan as the People’s Plan Campaign was restructured and named as Kerala Development Plan during the Xth Plan and a number of innovative steps were taken to strengthen and institutionalize the decentralization in the State. During XIth Plan, Government revamped the entire process, emphasising the concept of People’s Planning, focusing on institutionalisation of decentralisation. Kerala is a role model for other states in the area of financial and functional devolution.
XIIth Plan Approach
In order to make the system more efficient and effective the 12th plan approach envisaged some concrete steps to strengthen the institutions as well as the planning process. The plan approach pinpoints the following steps to strengthen the decentralized planning as a whole.
• Special Grama Sabhas will be convened for the families of differently able and mentally challenged persons.
• Formulation of District Master Plan with long term vision for spatial planning in all the districts will be carried out with the co-operation of Local Governments (LGs).
• Citizens Watch Committee will be established at the LG level to watch the progress of schemes by conducting social audit.
• The line departments and Local Self Government Institutions (LSGIs) will be encouraged to have a well defined approach to empowerment of women and Gender Development.
• They will also be encouraged to strengthen the Gender Budgeting initiative and also to move on to Gender sensitive monitoring and gender development programme.
• Provision for burial/cremation ground will be ensured in all local bodies
.
Planning Process
8.2 Kerala follows a multi staged planning process. Important stages of this methodology are outlined below.
• Environmental setting (need identification)
• Setting up of functionary groups
• Grama Sabha/Ward Sabha consultation with stakeholders
• Preparation of draft plan proposals by the functionary groups with the recommendation of Grama/Ward Sabha
• Discussion of the draft plan in development seminar
• Preparation of development report and vision document
• Strategy setting by the Panchayat committee
• Prioritisation and resource allocation by the Local Government
• Plan finalisation by Local Government
• Vetting of Plans (including Technical Approval)
• Approval by the District Planning Committee
• Plan implementation
Special Component Plan and Tribal Sub Plan under Decentralization
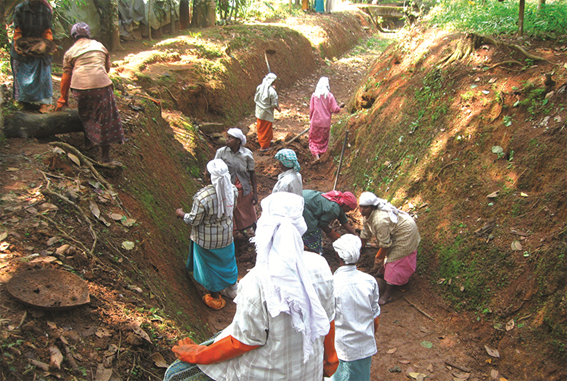
8.3 The Special Component Plan (SCP) and Tribal Sub Plan (TSP) are intended to provide special protective measures to safe guard the interest of scheduled castes and scheduled tribes. As one of the major objectives of decentralized planning is to improve the socio-economic status of SCs and STs and enhancing the quality of life, conscious efforts have to be made at Government as well as LG’s level to the effective implementation of these SCP/TSP.
8.4 The allocation of Plan fund to SCP and TSP from State Plan outlay is done according to the ratio of population of SCs and STs to total population of the State. Out of the total SCP/TSP Plan outlay, a certain percentage of funds are earmarked to LGs for implementation of schemes under decentralized planning. The projects under the SCP/TSP can be categorized into two viz, the beneficiary oriented schemes and infrastructural development schemes. The category wise allocation and expenditure of grant- in- aid to LGs are given Table 8.1 and Fig. 8.1 & 8.2.
Table 8.1
SCP & TSP Allocation of the LGs (` in Crore)
Year |
SCP |
TSP |
||
Allocation |
Expenditure* |
Allocation |
Expenditure* |
|
2007-08 |
443.30 |
442.17 |
66.55 |
71.17 |
2008-09 |
487.63 |
413.49 |
73.20 |
73.13 |
2009-10 |
535.99 |
518.43 |
80.51 |
79.78 |
2010-11 |
589.49 |
484.03 |
88.47 |
78.28 |
2011-12 |
660.23 |
697.69 |
99.09 |
93.07 |
2012-13 |
739.46 |
661.58 |
110.98 |
99.65 |
Source: Appendix IV of the Budget & Information Kerala Mission
*includes opening balance
Fig 8.1
Allocation and Expenditure of SCP
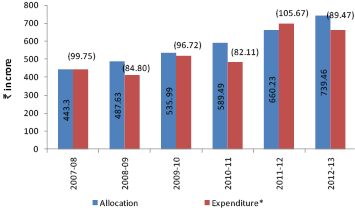
*including opening balance
Figures in parenthesis are the percentage of expenditure
Source: IKM & Appendix IV of the Budget
Fig 8.2
Allocation and Expenditure of TSP
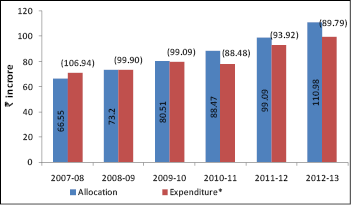
*including opening balance
Figures in parenthesis are the percentage of expenditure
Source: Appendix IV of the Budget & Information Kerala Mission
Major Changes in the Plan Guidelines
8.5 During the beginning of twelfth plan period some conscious efforts have been made to give more flexibility and freedom to the local bodies for Plan Formulation. Accordingly, some changes have been made in the Plan Guidelines, mainly in sectoral ceilings and project appraisal. Now there is no mandatory minimum or maximum ceiling in productive or service sector. However, in infrastructure sector the mandatory ceiling fixed is not more than of 45 per cent to Grama Panchayats and Block Panchayats, 55 per cent to Municipalities and Corporations and 50 per cent to District Panchayats in General Sector Plan Outlay. In addition to this, 10 per cent of the development fund must be earmarked for women component plan and 5 per cent to children, old age, differently abled, palliative care and other vulnerable groups. The Annual Plan Document of local bodies need only be approved by the District Planning Committee (DPC) instead of approving individual projects.
8.6 Another important aspect is that the Technical Advisory Group (TAG) mechanism has been discontinued. Instead of vetting the projects by the TAG concerned, it has been verified and certified by the implementing officer and then furnish to the officer of the same sector at the higher levels for getting it appraised and approved. Also Project Formulation Committee (PFC) can be constituted, if required, for providing technical expertise to prepare and approve the projects for LGs.
8.7 It is also important to notice that now under SCP/TSP the construction of roads is allowed within SC/ST habitat. Expenditure on prorata basis is allowed from TSP fund where such roads benefits both tribal and others. Width of the road in tribal colonies is enhanced to a maximum of 3 metres. Introduction of financial support for SCs/STs in getting employment abroad, assistance to meritorious students seeking admission in national and international institutions are some of the landmarks in the utilization of SCP/TSP funds.
Sulekha
8.8 Sulekha is a Plan monitoring software developed by Information Kerala Mission (IKM) for the formulation and monitoring of plan projects of local governments. The application of this software includes plan formulation, appraisal, approval, monitoring, revision processes and expenditure tracking of the plan projects of local governments of Kerala. Main features of Sulekaha software are:
• Tracks the entire course of plan formulation process of LGs by incorporating reports of working group, grama sabha, development seminars and social and other audit reports into plan projects.
• Facilitates generation of validation reports to ensure plan process pass through the approved guidelines and
• Facilitates standard project accounting-fixing financial & physical targets, schedules, details of approval, assets created, financial and physical achievements, etc.
Financing of LGs plans
8.9 Financial devolution is the most important element of Kerala’s decentralization process, which has enabled the LGs to receive the required resources from various sources for their plan. LGs raise the resources for the local development activities from the state’s plan allocation as well from its own revenue. LGs are provided plan allocation for implementing LGs own schemes as well as State and Central Schemes transferred to LGs.
8.10 The fund provided from the state plan to LGs is in the form of untied plan grant for planning and implementing projects for local development. LGs have full freedom in formulating and implementing schemes after deciding their priority subject to a general overall framework. The allocations of development fund to LGs are being done in three categories - General Sector, Special Component Plan (SCP) and Tribal Sub Plan (TSP). The outlay for each category is fixed on the basis of the recommendations of the IVth State Finance Commission (SFC) during the 12th Plan. The Commission recommended that at least 25 per cent of the likely plan size should be devolved to LGs for development purpose.
8.11 The total plan size of LGs during 2012-13 was ` 8594.96 crore of which the plan grant from Government constituted 45 per cent. The own contribution of LGs constituted 7.41 per cent and the rest was from other sources. The percentage of expenditure in 2012-13 recorded only 47 per cent while it was 50 per cent in 2011-12. Out of the total expenditure, the plan grant share is 67.41 per cent, own fund share 4.6 per cent, sponsored schemes together with externally aided source 3.53 per cent and the balance goes to funds from other sources. Even though there was 9.62 per cent hike in the plan grant allocated to LGs in 2012-13, proportionate increase was not noticed in the plan grant utilization, which is the major resource of LGs plans. Source wise funding details for 2012-13 and the respective percentage to total fund is given in Fig. 8.3 and sub-sector wise detail of 2011-12 and 2012-13 are given in Appendix 8.1.
.
Fig 8.3
Sources of Financing LGs Plan
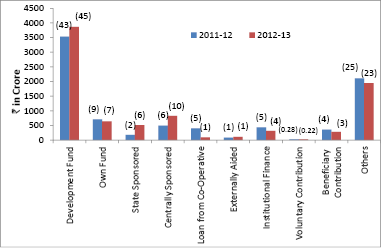
*Figures in Parenthesis are the respective percentage to total fund source
Source: Information Kerala Mission, 2013
Performance of Local Governments -XIIth Plan Review
8.12 The LGs allocated their plan funds mainly in Productive, Service and Infrastructure sectors. As far as the LGs are concerned, they have a vital role in eradicating poverty at the local level by achieving increased production, productivity, employment and income generation. The total plan fund available with LGs for allocating funds to various development sectors during 2012-13 was `3870.33 crore.
8.13 Out of the total grant- in- aid, only `2741.67 crore was utilized for different sectors. Thus, the overall utilization percentage in 2012-13 was 71 per cent which is lower than in 2011-12 i.e. 75 per cent. The expenditure pattern shows wide variations among local bodies. Among the three tier rural LGs the performance was better in Block Panchayat with 84 per cent expenditure followed by Gama Panchayats 73 per cent and District Panchayats 62 per cent. The percentage of expenditure was noted lowest by the Municipalities with 57per cent. The tier wise details of outlay, allocation and expenditure of grant-in-aid during 2011-12 and 2012-13 are given in Fig. 8.4 and Appendix 8.2.
.Fig 8.4
Grant-in-Aid to LGs, Allocation and Expenditure
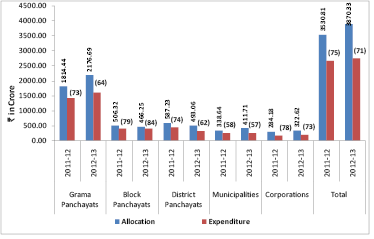
*Figures in Parenthesis are the per cent of expenditure
Source: Appendix IV of the Budget & Information Kerala Mission
Category - wise performance
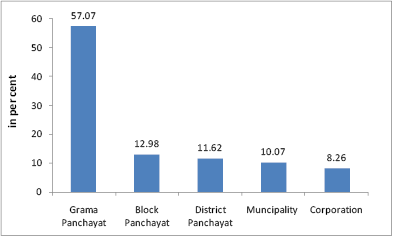
8.14 As mentioned earlier, the allocation of grant-in-aid to LGs is in three categories – General Sector, Special Component Plan (SCP) and Tribal Sub Plan (TSP). The outlay for each category is fixed on the basis of the recommendations of the State Finance Commission. During the period under review, an amount of `3870.33 crore was allocated to different categories of which general category, SCP & TSP constituted 68 per cent, 28 per cent and 4 per cent respectively to the total allocation. An analysis of category wise utilization during 2012-13 shows that the percentage of expenditure under General Sector was 74.72 per cent of the plan outlay and in the case of SCP and TSP it was just above 62 per cent as against the overall average of 70.84 per cent. Shortfall in expenditure of SCP/TSP is a common phenomenon for all tiers of LGs except with the case of Block Panchayats. The category wise and local body wise allocation during 2012-13 are given in Table 8.2 and in Fig. 8.5 (see Appendix 8.2).
Table 8.2
Category wise Allocation of Grant-in-aid to LGs during 2012-13 ( ` in Crore)
pe of LGs |
General |
SCP |
TSP |
Total |
1 |
2 |
3 |
4 |
5 |
Grama Panchayats |
1524.22 |
556.62 |
95.85 |
2176.69 |
Block Panchayats |
279.22 |
158.88 |
28.15 |
466.25 |
District Panchayats |
276.82 |
180.37 |
35.87 |
493.06 |
Municipalities |
317.79 |
91.64 |
2.28 |
411.71 |
Corporations |
243.56 |
79.05 |
0.01 |
322.62 |
Total |
2641.6 |
1066.56 |
162.17 |
3870.33 |
Source: Information Kerala Mission
Fig 8.5
Category wise expenditure of Grant-in-Aid to LGs during 2012-13 ( per cent)
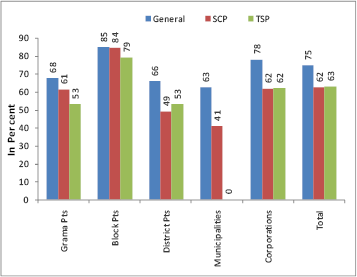
Source: Information Kerala Mission 2013
Sector-wise performance
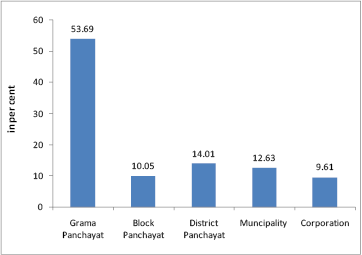
8.15 The LGs allocate their plan funds mainly in three sectors viz, productive, service and infrastructure. Productive sector includes agriculture and allied sectors, soil and water conservation, irrigation and industries. Service sector consists of education and allied sectors, health and allied services, women and child development, labour and labour welfare and infrastructure sector includes energy, transportation and buildings. The total fund available for these sectors for the year 2012-13 was `3870.33 crore. Out of this, the allocation to productive, service and infrastructure sectors were 9 per cent, 58 per cent and 33 per cent respectively and the corresponding figures in the previous year it was 15 per cent, 59 per cent and 26 per cent respectively. The sector wise allocation and expenditure details in 2012-13 are given in Fig. 8.6. While it can be seen that allocations to all sectors have increased in 2012-13 compared to 2011-12, the quantum of increase in the service sector is much higher than the others. The service sector also occupies a major share compared to others in allocations. It can also be observed that the investment in productive sector has reduced from 15 per cent to 9 per cent which is not a good trend. The sector wise allocation and expenditure details in 2011-12 & 2012-13 are given in Appendix 8.3.
Fig 8.6
Sector wise Allocation to LGs
Grants-in-Aid and its Utilisation
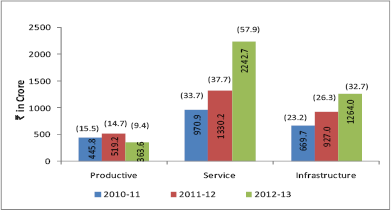
*Figures in Parenthesis are the percentage to total allocation in each sector
Source: Information Kerala Mission 2013
Productive Sector
8.16 Out of the total plan fund made available to productive sector by LGs, 35 per cent of fund was earmarked to the implementation of various schemes under agriculture and allied sectors in 2012-13 while it was 68 per cent in the previous year. The LGs have given more weightage to the agriculture and allied sectors compared to irrigation, soil conservation, industries etc. The initiative of rural local bodies in this respect is worth mentioning as there was considerable increase in their allocation as much as 88 per cent to this sector during 2012-13. The grama panchayats have given major attention to the implementation of this programme and allocated 60 per cent their allocation to this sector. However, the performance of Block Panchayats is better in the productive sector since they have spent 74 per cent of funds of their allocation to this sector. The details of allocation and expenditure during 2012-13 is given in Table 8.3 and the percentage of allocation to different tiers is shown in Fig. 8.7. The details of achievements during 2011-12 and 2012-13 are given in Appendix 8.4
Table 8.3
Productive Sector- Local Body wise Allocation & Expenditure during 2012-13 (` in Crore)
Type of LGs |
2012-13 |
||
Allocation |
Expenditure |
percentage |
|
Grama Panchayat |
217.48 |
155.00 |
71.27 |
Block Panchayat |
47.94 |
35.57 |
74.20 |
District Panchayat |
55.06 |
32.45 |
58.94 |
Muncipality |
26.14 |
13.28 |
50.81 |
Corporation |
15.70 |
5.08 |
32.33 |
Total |
362.32 |
241.38 |
66.62 |
Source: Information Kerala Mission 2013
Fig 8.7
Percentage share of productive sector allocation to different Tiers of LGs during 2012-13
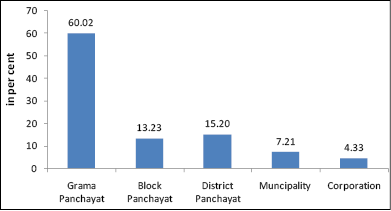
Source: Information Kerala Mission 2013
Service Sector
8.17 Under Service Sector all LGs have given more attention to enhance the quality of basic services given to public through welfare oriented programmes with special emphasis on health and education. In utilizing fund, the service sector is seen better in spending than the productive and infrastructure sectors. Block Panchayats performed well in the service sector by achieving 90 per cent of expenditure. There has been overall hike in both allocations and its utilizations in service sector during 2012-13 compared to 2011-12. It reveals the importance given to social service sector and health in particular. The sector wise allocation and expenditure are shown in Table 8.4 and percentage share of service sector to different tiers are shown in Fig. 8.8 and sub-sector wise details for 2011-12 & 2012-13 are shown in Appendix 8.5.
Table 8.4
Service Sector - Allocation & Expenditure during 2012-13 ( ` in Crore)
Type of LGs |
2012-13 |
||
Allocation |
Expenditure |
Per cent of |
|
Grama Panchayat |
1279.84 |
984.39 |
76.92 |
Block Panchayat |
291.16 |
262.71 |
90.23 |
District Panchayat |
260.71 |
191.51 |
73.46 |
Muncipality |
225.75 |
146.70 |
64.98 |
Corporation |
185.27 |
114.24 |
61.66 |
Total |
2242.73 |
1699.55 |
75.78 |
Source: Information Kerala Mission 2013 Fig 8.2
Category wise Allocations during IXth, Xth and XIth 5 year Plans
Fig 8.8
Percentage share of service sector allocation to different Tiers of LGs during 2012-13
Source: Information Kerala Mission 2013
Infrastructure Sector
8.18 During the review period, the LGs set apart 33 per cent of the total allocation was earmarked to infrastructure sector while it was 26 per cent in 2011-12. It shows an increasing tendency to allocate more fund under this sector. Among the tiers, the Grama Panchayat allocated 54 per cent of their allocation to this sector. The expenditure during 2012-13 diminished to 63 per cent from 73 per cent in 2011-12. In the utilization of plan fund in this sector, Block Panchayats and Grama Panchayats achieved 75 per cent and 67 per cent of expenditure during 2012-13. Against the total allotment made in the infrastructure sector, 76 per cent of fund was earmarked for transportation facilities and the corresponding expenditure was 66 per cent. Transportation and building sectors together constituted 91 per cent of funds from their total outlay in the infrastructure sector. Tier wise, sub sector wise allocation and expenditure details in 2012-13 are given in table 8.5 and percentage share of allocation to different tiers is shown in Fig. 8.9 and sub-sector wise details of 2011-12 & 2012-13 in Appendix 8.6.
Table 8.5
Infrastructure Sector - Allocation & Expenditure during 2012-13 ( ` in Crore)
Type of LGs |
2012-13 |
||
Allocation |
Expenditure |
Percentage |
|
Grama Panchayat |
679.37 |
451.83 |
66.51 |
Block Panchayat |
127.15 |
94.8 |
74.56 |
District Panchayat |
177.28 |
93.46 |
52.72 |
Muncipality Corporation |
159.82 |
95.11 |
59.51 |
Corporation |
121.65 |
65.53 |
53.87 |
Total |
1265.27 |
800.74 |
63.29 |
Source: Information Kerala Mission 2013Auditing
Fig 8.9
Percentage Share of Infrastructure Sector Allocation to different Tiers of LGs during 2012-13
Source: Information Kerala Mission 2013
Performance under Special Sector Plans
8.19 For women component plan and plan for disadvantaged groups (aged, children, disabled, palliative and other vulnerability) in the plan of local governments is one of the salient features in Kerala’s Decentralization. The expenditure in Women Component Plan (WCP) and special programme for children showed a slight decline from 69 per cent in 2011-12 to 68 per cent during 2012-13. In the case of special programme for children the expenditure increased from 87 per cent to 88 per cent. In addition, separate amounts of `26.78 Crore and ` 40.35 crore was set apart for palliative care and other vulnerability groups. Out of this, `20.50 crore and `100.23 crore were expended for their well being. Details of allocation and expenditure during 2012-13 are given in Table 8.6 and the figures in 2011-12 & 2012-13 are given in Appendix 8.7.
Table 8.6
Allocation and expenditure of Special Sector Plan for 2012-13(` in crore)
Type of LGs |
2012-13 |
||
Allocation |
Expenditure |
Percentage |
|
Women Component Plan |
431.01 |
294.21 |
68.26 |
Special programme for children |
169.14 |
149.37 |
88.31 |
Special programme for oldage |
28.30 |
16.21 |
57.26 |
Differently abled |
65.81 |
50.21 |
76.30 |
Other Vulnerability |
140.35 |
100.23 |
71.42 |
Palliative |
26.78 |
20.50 |
76.55 |
Box 8.1
Introduction of Award system
| State Planning Board has initiated an award system during 2012-13 onwards to the first three Districts which complete successfully, in all respects, the Plan formulation and getting approval of the projects of the local bodies from the District Planning Committee. In the year 2012-13, Wyanad, Alappuzha and Ernakulam districts were selected as first, second and third respectively. The Hon’ble Chief Minister distributed the awards on the occasion of the State Development Council (SDC) meeting held on 22nd February 2013. |
Kudumbashree
8.20 Kudumbasree - the State Poverty Eradication Mission is an innovative mechanism initiated by the State Government in 1998 under the Local Self Government Department with the primary objective of eradicating poverty. Kudumbashree differs from conventional thinking and it perceives poverty not just as the deprivation of money but as the deprivation of basic human rights and denial of spaces to exercise one’s agency and subjectivity. It attempts to enhance the standard of living of its members through micro finance and income generating activities like micro enterprises and innovative interventions in an integrated way like samagra and consortia, collective farming, taking care of the destitute through Ashraya, gender self learning, interventions to address gender based violence through help desk, a short stay home for the affected; designing special programmes for the ST population, especially micro- level planning in all the tribal hamlets and promoting total inclusion of the ST into the Kudumbashree network, empowering children through Balasabha and Balapanchayats and providing care and support to the mentally challenged through BUDS school and BUDS rehabilitation centers, thus providing a convergent platform for the economic and social needs of the society.
Organization structure
8.21 Government of Kerala has brought the whole Kudumbashree programme under its department of Local Self Government with a separate wing namely “Kudumbashree -The State Poverty Eradication Mission”. The Chairman of the mission is the Minister of Local Self Government and the Vice Chairman is the Secretary to the Department of Local Self Government. For effective convergence of the programme, a three tier Community Based Organisation (CBO) is in action.They are Neighborhood Groups (NHGs), Area Development Society (ADS) and Community Development Society (CDS).The lowest tier constitutes the Neighbourhood Group/ Ayalkoottam consisting of 20-40 women members selected from the poor families. Area Development Society, the second tier, is formed at ward level of panchayat/ municipality by federating 10-15 NHGs. Community Development Society (CDS), is formed by federating various ADSs at the Panchayat/Municipal/ Corporation level.
Kudumbashree as a support system for strengthening LGs
8.22 Kudumbashree is considered as an innovative practice in the field of poverty alleviation and women empowerment. The decentralized planning process in Kerala provided Kudumbashree a positive environment. It has developed a close interface with the LGs in supporting the development activities at the local levels. Kudumbashree network is used for implementing the social welfare programmes of the panchayat, like destitute rehabilitation and universalizing the take home ration, for providing special assistance to the development of physically and mentally challenged, and in tribal development programmes. This development initiatives is what makes the intervention of Kudumbashree different from other CBOs. All these are significant areas of interface of the CDS with the local government.
8.23 Members of the CDS are members of the working groups formed under the aegis of LGs for project preparation. The governance plans provide an opportunity for factoring community monitoring into local government programmes. Success of any experience of decentralization demands a highly sophisticated coordination of people’s participation. It works as an effective interlocutor between the community and the panchayat. This most needed position of the Kudumbashree not only helps it in carrying out its roles and responsibilities, but also helps the panchayat to address the local economic issues in an effective manner. CDS Action Plan, Asraya and BUDS Schools of the Kudumbashree are exemplary interventions towards the LGs interface.
Limitations of Kudumbashree Mission
8.24 The initiative to position Kudumbashree as a rights-based agency of women, form a tool for poverty alleviation, was effectuated, largely, because of the internal flexibility of Kudumbashree. However, it is this flexibility and elasticity that made Kudumbashree spread too much that in certain interventions it could not bring out the qualitative outcome as envisaged. For instance, the intervention in the area of micro enterprises, though proving to be very effective in certain areas like the catering units of Cafe Kudumbashree, similar outcome could not be claimed in other units of micro enterprises.
8.25 The second limitation is the inadequacy in the convergence and integration of Kudumbashree interventions with other stakeholders and NGOs working in the similar areas, especially in the case of our flagship programmes like Asraya and Snehitha. It is to be documented that Ashraya interventions are indeed exemplary in certain areas, however an effective evaluation method to monitor Asraya at the state level could not be brought about yet.
8.26 Another limitation is its intervention in the coastal and tribal belt, the most excluded periphery in Kerala. Despite the special programmes if Kudumbashree like special Asharya and special NHGs designed to cater to the need of the tribals, a more specific, concrete and effective engagements are needed to address the social and economic issues of coastal and tribal communities.
8.27 Though Kerala achieved a breakthrough in participatory poverty reduction through Kudumbasree with the leadership role of LGs, the benefits of anti-poverty policies and programmes do not reach the absolutely poor at a satisfactory level. So the mission has to sensitize the LGs about their new role in poverty eradication. Therefore, conscious efforts have to be made at the level of each local self government for the effective implementation of the system.
Outlook for Local Government
It can be observed without doubt that the decentralization process has made its impact in the local level planning and has been deep rooted. The systems developed under this process have become part and parcel of the development activities at the grass root level. Moreover the innovative initiatives to organize people participation through different organizational set up including Kudumbashree have been appreciated widely. However, more efforts are required to bring the socially backward sections in the society including SCs/STs, and also provide assistance to oldage people, disabled and others facing difficulties for leading a normal life. Similarly conscious and consistent efforts have to be made for the sustainability of the whole process. While adequate and increasing budgetary funds are provided to LGs, there is inadequate capacity among local Governments to conceptualize, preapare detailed project reports, implement and monitor local projects. Project management skills are yet to be attained. Capacity buiding is therefore the most important gap that needs to be bridged.