Chapter 2
AGRICULTURE AND ALLIED SECTORS
Introduction
Kerala is known for its lush green landscape, its dense forest cover, abundant water bodies, long coastline and its environment friendly culture. Agriculture, Fishing and Forestry contributed 9 percent to Kerala’s GSDP in 2011-12 (constant prices). The share has been falling steadily over the years. There has been negative growth in this sector in all the years of the XIth Plan except in 2008-09. The low availability of land and the high cost of other factors of production (farm labour, fertilizer, etc), the excessive dependence on volatile international commodity prices and the vagaries of the monsoon have resulted in low farm viability. However, this sector is very significant from the point of view of rural livelihood options, food security, raw material for the food processing industries and for exports. It is this sector which gives character to the State and various initiatives have been taken to promote crop development, animal husbandry and fisheries in Kerala.
This chapter deals with the performance of various agriculture crops in Section 1 and discusses the major concerns (drought, declining production of food crops, high fertilizer prices, threat of plant pests etc.) as well as the initiatives taken by Government to mitigate them. An analysis of Livestock Development and Fisheries has also been made in Sections 2 and 3. Separate sections 4,5 and 6 have been devoted to Water Resources, Forests and Environment, bringing out the critical issues and recent key initiatives taken. A factor of production which is as critical to this sector, as to any other sector is capital for timely and adequate investment. Various sources of agricultural finance and co-operative credit are detailed in this chapter in Section 7. This chapter also includes a section on Rural Development (Section 8) where various schemes promoting rural employment and rural infrastructure, which are essential to the overall growth of the farm sector and well being of farmers and agricultural workers are discussed. Food security measures in the state are brought out in Section 9.
The inherently vulnerable, predominantly commodity trade dependent economy of Kerala’s agriculture has been characterized by a high degree of volatility. Kerala economy had developed strong linkages with international markets and has historically been tied to trade and export. The export orientation of crops like spices, cashew, coffee, tea and marine products and indirect implication of palmoil import on coconut prices are subjected to global vulnerability. Growth is estimated to have weakened appreciably in developed countries and low growth and uncertainty in advanced economies are affecting the market opportunity of commodities resulting in unremunerative prices of farm produce and decline in growth in agricultural GSDP. The instability in farm production is also causing serious shocks to supply and farm income and there is a growing concern about the increased volatility in farm production, prices and farm income. Increased intensity and frequency of moisture stress , altered hydrological cycles and precipitation variation caused in recent periods have negative implications and cause instability in the perennial crop based agrarian economy of the State.
Performance of Agriculture
2.2 The growth performance of the agriculture sector has been fluctuating across the plan periods. It witnessed a negative growth rate of 1.3 percent in XIth Five Year Plan while a positive growth of 1.8 percent in Xth Plan period. The quick estimate of 2011-12 indicated a negative growth of 1.6 percent over the previous year. The provisional estimate of agricultural income of the state again shows a negative growth of 4.5 percent during 2010-11.The crippling growth rate in agriculture as against a reasonably robust annual growth rate of GSDP of the State is a cause of concern.
2.3 The agriculture in Kerala has undergone significant structural changes in the form of decline in share of GSDP from 26.9 Percent in 1990-91 to 9.1 percent in 2011-12, indicating a shift from the agrarian economy towards a service sector dominated economy. The annual growth rate of agricultural income and share of agricultural GSDP for the last five years are shown in Table 2.1.
Table 2.1
Annual Growth Rate in Agricultural Income and Share of Agricultural GSDP in Kerala
(Base 2004-05)
| SL No. | Year |
Rate of change over previous year | Share of Agriculture and Allied Sectors in GSDP |
1 |
2007-08 |
-2.2 |
13.2 |
2 |
2008-09 |
2.1 | 12.7 |
| 3 | 2009-10 | -3 | 11.5 |
| 4 | 2010-11* | -4.5 | 10.1 |
5 |
2011-12** |
-1.6 |
9.1 |
*Provisional ** Quick
Source: Directorate of Economics and Statistics
2.4 Although the share of agricultural GDP (agriculture and Animal Husbandry alone) has declined in almost all states, agriculture is an important contributor to GSDP in some States in 2011-12 like Punjab (21.5%), Assam (18.1%), Bihar (15.9%), Uttar Pradesh (20.3%). On the other hand the States like Tamilnadu (6.6%) and Kerala (7.7%) the share of agriculture is relatively low. But a large share of rural population in almost all the States is dependent on agriculture for employment and livelihood. The share of agriculture and allied sectors including fisheries and forestry is only 9.1 percent in the State in 2011-12.
2.5 Reviving the agriculture sector require a quantum increase in productivity from the current levels. This in turn requires technological breakthrough given the limited supply of land and other structural rigidities, addressing low level of mechanization, shortage of irrigation facilities, treatment of soil acidity and multiple nutrient deficiencies, plant health management, remunerative prices and poor extension services.
SECTION 2
Monsoon 2012
2.6 The Pre monsoon rainfall received in the state from Ist March 2012 to 31st May 2012 was normal with a departure of -19 percent from the normal. The actual rainfall received during the period was 308.5 mm. Ernakulam District recorded excess pre monsoon rainfall (23%) and Kannur District had scanty rainfall (-68% departure from normal). Normal rainfall was received in 7 districts of the state
( Alappuzha, Idukki, Kollam, Kottayam, Pathanamthitta, Thrissur and Wayanad). Pre monsoon rains were deficient in 5 Districts ( Kasargod, Kozhikkode, Malappuram, Palakkad and Thiruvanathapuram)
2.7 Southwest monsoon current advanced over the Andaman Sea on 23rd May with a delay of about 3 days and set in over Kerala on 5th June, 4 days later than its normal date of 1st June. The actual rainfall received in Kerala during the South West Monsoon season (1st June to 30th September 2012) was 1551.3 mm as against the normal rainfall of 2039.6 mm which was -24 percent deficient. During the previous SW monsoon (2011) Kerala had received an actual rainfall of 2215.8 mm. Eleven districts in the state received deficient rainfall during 2012, while Kasaragod, Kannur and Kozhikkode districts normal rainfall. Deficiency in SW monsoon was highest in Wayanad District (-49%) followed by Thiruvananthapuram (-43%).(Fig.2.1)
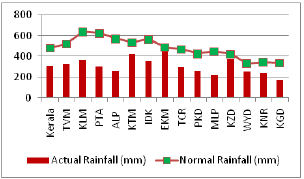
2.8 During the North East Monsoon season 2012 ( 1st October to 31st December 2012) the state received 310.8 mm of rainfall as against 480.7 mm of normal rainfall which was deficient with a percentage departure of -35 percent from the normal. Twelve districts in Kerala received deficient rainfall during this season except Ernakulam and Kozhikkode which recorded normal rainfall. Percentage departure from the normal was highest in Alappuzha District( -54%) followed by Malappuram and Pathanamthitta districts and both showed a deviation of -51 percent from the normal rainfall (Fig.2.2). District wise rainfall distribution in the state during 2012 is given as Appendix 2.1
Fig 2.1
South West Monsoon received in Kerala during
1st June – 30th September 2012
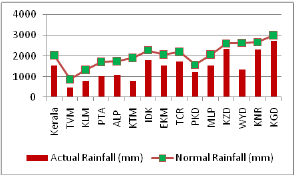
Fig 2.2
North East Monsoon received in Kerala during
1st October – 31st December 2012
Drought Situation 2012
2.9 During North East monsoon season the most affected districts during South West monsoon season ie. Thiruvananthapuram and Wayanad received comparatively more and distributed rainfall. But other districts still received less rainfall compared to normal. This adversely affected the second (Mundakan) crop of rice from which the farmers expected maximum yield. In addition to this Alappuzha district also suffered from salt water inundation. In North Kerala, Malappuram, Kasaragod and Palakkad were the most affected districts. A long dry spell of more than 7 months is expected in these districts. Another most affected crop is coconut. The nut yield in the coming year is likely to be affected. Moreover these districts face more problems for raising summer vegetables due to deficiency of water. (Source : Quick study by Project team on Crop Weather Analysis and Climate Change Adaptation Study, Kerala Agricultural University, 2013).
2.10 Rainfall for the country as a whole during the period 1st June to 30th September, 2012 is 8 percent less than long period average. Major States affected were Jharkhand, West Bengal, Tripura, Maharashtra, Andhra Pradesh, Karnataka, Kerala and Tamil Nadu.The North East monsoon commenced on 19th October 2012 in the country and out of a total of 36 met sub-divisions, 15 met
sub-divisions constituting 39 percent of the total area of the country have received excess / normal rainfall and 21 met sub-divisions constituting 61 percent of the total area of the country have received deficient/scanty rainfall. Cumulative Post-Monsoon Rainfall for the country as a whole during the period 1st October to 31st December, 2012 is 21 percent less than Long Period Average (LPA). Major states affected with water shortage were Jharkhand, West Bengal, Tripura, Maharashtra, Andhra Pradesh, Karnataka, Kerala and Tamil Nadu.
2.11 The deficiency of monsoons has affected the reservoir storage levels in major reservoirs in the state. The low levels of reservoir storage further narrows the chances of providing life saving irrigation to these crops and the end result will be extensive crop damage. The entire state has been declared as drought affected and a series of initiatives were proposed for implementation including restructuring loans with the support of commercial banks. Departments may prepare both short term and long term strategies for addressing drought situation. The restoration of tanks and ponds, basin wise management strategies for water management, micro irrigation and agronomic measures for improving water use efficiency needs to be implemented urgently.
Land Use
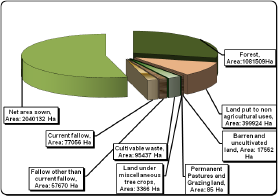
2.12 Data on land use pattern of Kerala for the year 2011-12 is given in Appendix 2.2. Out of a total geographical area of 38.86 lakh ha. net sown area is about 53 per cent. The net sown area has declined by 1.5 percent in the current year over 2010-11. The share of total cropped area in the total geographical area is 68 percent. It marked an increase of 14296 ha during 2011-12 over the previous year while the net area sown declined by 31375 ha over the previous year. The share of land under non-agricultural uses out of total geographical area is 10 per cent in 2011-12. There is an increase in the area under current fallow (1028 ha) and increase in the area under fallow other than current fallow (5727 ha) during 2011-12. The area under cultivable waste also increased by 3772 ha and barren and uncultivated land declined by 2021 ha. The land use pattern is shown in Figure 2.3
Fig 2.3
Land use Pattern of Kerala (2011-12)
Trend in Area, Production and Productivity of Crops and Performance
2.13 In Kerala total food grain production reached to 0.6 lakh MT during the respective year. Data regarding the area, production and productivity of important crops grown in Kerala are shown in Table 2.3 and Appendix 2.6. Out of a gross cropped area of 26.6 lakh ha. in 2011-12, food crops comprising rice, pulses and tapioca occupy 10.8 per cent. Kerala state which had a low base in food production is facing serious challenges in retaining even this meager area. Kerala agricultural economy is undergoing structural transformation from the mid seventies by switching over a large proportion of its traditional crop area which was devoted to subsistence crops like rice and tapioca to more remunerative crops like banana and plantations.
Table 2.2
Area, Production and Productivity of Principal Crops
SL No. |
Crops |
Area (Ha) | Production (MT) | Productivity (Kg/ha) | |||
| 2010-11 | 2011-12 | 2010-11 | 2011-12 | 2010-11 | 2011-12 | ||
1 |
Rice | 213187 | 208160 | 522738 | 568993 | 2452 | 2733 |
2 |
Pulses | 3824 | 3668 | 2908 | 3128 | 760 | 853 |
3 |
Pepper | 172182 | 85335 | 45267 | 37989 | 263 | 445 |
4 |
Ginger | 6088 | 6908 | 33197 | 37130 | 5453 | 5375 |
5 |
Turmeric | 2391 | 2970 | 6198 | 7946 | 2592 | 2675 |
6 |
Cardamom | 41242 | 41600 | 7935 | 10222 | 192 | 246 |
7 |
Arecanut | 99834 | 104548 | 99909 | 121623 | 1001 | 1163 |
8 |
Banana | 58671 | 59069 | 483667 | 514054 | 8244 | 8703 |
9 |
Other Plantains | 49129 | 48747 | 353772 | 330634 | 7201 | 6783 |
10 |
Cashewnut | 43848 | 54052 | 34752 | 36743 | 793 | 680 |
11 |
Tapioca | 72284 | 74498 | 2408962 | 2567953 | 33326 | 34470 |
12 |
Coconut * | 770473 | 820867 | 5287 | 5941 | 6862 | 7237 |
13 |
Coffee | 84931 | 84413 | 65650 | 68175 | 773 | 808 |
14 |
Tea | 36965 | 37028 | 57291 | 57903 | 1550 | 1564 |
| 15 | Rubber | 534230 | 539565 | 770580 | 788940 | 1442 | 1462 |
Source: DES
* Production of coconut in million nuts and productivity in numbers
2.14 During 2011-12, the area under rice declined by 5027 ha. In the case of pepper, the area declined from 1.7 lakh ha in 2010-11 to 0.9 lakh ha. in 2011-12. Area under coconut was 7.7 lakh ha in 2010-11. But it increased to 8.2 lakh ha during 2011-12. All the major crops except rice and pepper showed increase in area in 2011-12. Similarly production of all major crops increased in 2011-12 except pepper. Substantial increase in production of rice is reported to the tune of 9 percent in 2011-12. In the case of coconut 12 percent increase in productivity is also reported.
2.15 With the use of the index numbers it is easier to know the trends over time with respect to area, production, productivity of prominent crops. Index of area under food grains reveals again a declining trend. The deteriorating trend is more visible in the case of cereals. Area under pulses also shows a consistent fall during 2010-11 and 2011-12 periods. Despite of it, production and productivity levels improved in the respective periods. Area under coconut, plantation crops, vegetables and fruits, cashew and tapioca shows an increasing movement. Index of production of all these crops are expanded during the period. The productivity index of cashew fell drastically during 2011-12 due to rise in area coupled with comparatively small increase in production. Details are given in Appendix 2.7
Crop Wise Analysis
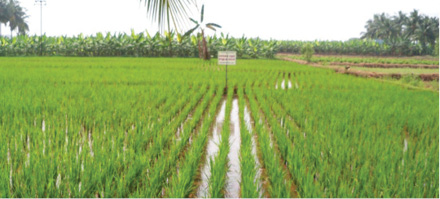
Rice
2.16 In order to increase food production in the state, a major food security project was launched in 2008-09. As part of the project, regional subprojects were launched with additional incentives, interest free loans, project based support for fallow land cultivation and a package of support measures. The procurement price was also enhanced to र13 per kg and further to र17 per kg. A modernization programme for lift irrigation was also initiated as part of the food security project. A rehabilitation project on ponds was also initiated. The outputs in terms of area is discouraging even after enacting paddy land and wetland conservation act as well as after enhancing the procurement price. The paddy procurement has extended to all districts from February 2012. For procurement alone an amount of र107.65 crore was paid to Civil Supplies Corporation. The area under rice has been declining consistently over the last several years. After a long period of continuous decline, area under rice increased from 2.29 lakh ha in 2007-08 to 2.34 lakh ha in 2008-09 and sharply declined by 20828 ha in 2010-11 period over to the previous year. During 2011-12, the area under rice declined by 5027 ha, but the production has increased by 0.5 lakh MT. The production is increased due to increase in productivity. The productivity increased to the tune of 11.5 percent. The upland rice development was implemented in 6539.06 ha and fallow land cultivation in another 731.7 ha. Reorganization of rice development scheme with focus on potential areas covering regional targets and technology package is essential with effective procurement operation.
System of Rice Intensification (SRI)
2.17 The national target for the food grain production has been fixed at 245.00 million tonnes for 2011-12. The production of food grains during the period is estimated at 259.3 million tonnes compared to 244.8 million tonnes in 2010-11. Rice production in the country is estimated at 92.8 million tonnes. Details are given in Appendix 2.8 to 2.13
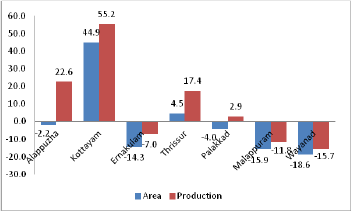
Fig 2.4
Percentage change in Area and Production of Rice in Major Districts of Kerala
during 2011-12 over 2010-11
Coconut
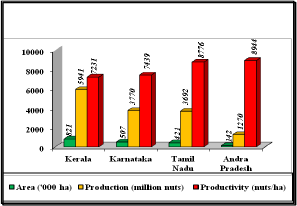
2.18 Coconut based farming is the main stay of farmers of the State with a coverage of 8.2 lakh ha which occupies 40.2 per cent of the net cropped area. During 2010-11, area and production of coconut in the State were declined by 1.2 percent and 6.7 percent respectively. In 2011-12, the situation has improved with 6.6 percent expansion of area and 12.4 percent upsurge in production over the previous year. The productivity levels of coconut in Kerala also improved (5.5%) significantly, but is still lower than in other southern states (Fig.2.5).
2.19 The implementation of massive replanting of root wilt affected palms with seedlings of elite palms could be improved immediately campaign mode. Generation of technologies for different agro ecological situations may improve the level of adoption. Integrated farming system with due emphasis on multi-tier cropping systems needs to be promoted in different agro ecological situations for improving income of the farmers. Effective harvesting machines also need to be developed for promotion. Restructuring of the cluster development programme is also essential for more effectiveness. The initiatives of the Coconut Development Board for the skill development and formation of producers societies is expected to address a basic issue in coconut development. Restructuring of the cluster development programme is also essential for more effectiveness. The isolated attempts of production of dwarf coconut seedlings and hybrids need to be scaled up substantially with the support of Research and Development institutions. The strengthening of procurement of coconut as well as promotion of Neera are essential for the survival of the crop. In India, coconut is grown in an area of 2039.1 million ha. producing 14006.5 million nuts with a per hectare productivity of 6869 kg of nuts in 2011-12. Kerala’s share in area as well as production of coconut in the country is declining over time. Kerala stands top by contributing 42.4 percent of total production of the crop in the country. Details are given in Appendix 2.14. The area, production and productivity of coconut in southern states are shown in figure 2.5.
Fig. 2.5
Area, Production and Productivity of Coconut in Major States of India (2011-12)
Source: Department of Agriculture & Co operation (Horticulture Division)
Department of Economics and statistics, Kerala
Pepper
2.20 In Kerala, the area under pepper is estimated at 0.85 lakh ha and production at 0.38 lakh MT during 2011-12. It is noted that the production has declined by 16.1 percent in the respective period caused by erratic weather condition in growing regions and also on account of structural issues. Insect pest problem of erythrina(standard),weather viability, absence of alternate standards, poor productivity, fluctuating prices etc. compounded the declining production.
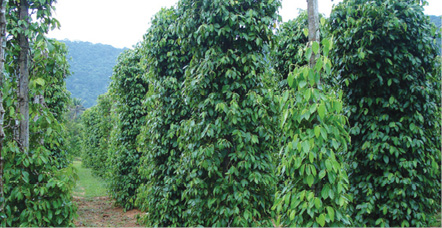
Pepper Garden
2.21 The domestic price of pepper shows an upward trend from the mid of twenties and reached to र 418.58 per kg in October 2012 and further declined in र 378.04 per kg. in February 2013. Revitalization of pepper is essential for improving the livelihood of farmers. A convergence approach is to be followed for implementing schemes by the Spices Board, State Horticulture Mission and the Department of Agriculture. Reorientation of pepper development scheme is required to regain the supremacy of the crop covering technology and market support, revival of pepper samithies, good quality planting materials and promotion of alternate standards.
2.22 During 2011-12, in India a total quantity of 26,700 tonnes of pepper valued र 878.13 crore have been exported as against 18,850 tonnes valued र 383.18 crore in the last year. Pepper production in India during 2011-12 is estimated at 48 thousand tonnes. This stagnant nature of pepper production in recent years is mainly due to low productivity and disease affected pepper gardens.
2.23 World pepper production during 2011-12 was estimated at 298.4 thousand tonnes compared to 329.7 thousand tonnes in 2010-11 period which shows a decline of 31.3 thousand tonnes. Vietnam holds the first position with 33.5 percent share of world pepper production and where India contribute 16.1 percent share with 2nd rank.
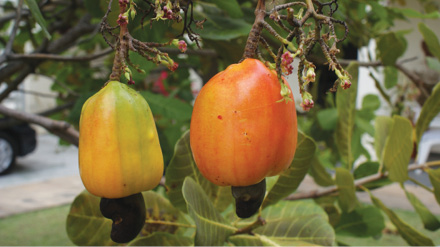
Cashew
2.24 Area under the crop in Kerala, has been declining steadily from 1.25 lakh ha. in 1988-89 to 0.44 lakh ha. in 2010-11. During 2011-12, there is 23.3 percentage increase in the area (0.54 lakh ha) and the production also surged to 0.37 lakh MT from 0.35 lakh MT in 2010-11. The share of Kerala in the area under cashew in the country has come down from 23 per cent in 1987-88 to 5.4 percent in 2011-12 and the corresponding decline in share of production is from 31 per cent to 5.3 percent. Area and production are increasing steadily in other producing states in the country. Even though the major share of area under cashew comes from Andhra Pradesh (19.5%), Maharashtra is the leading producer with 32.2 percent share in production during 2011-12; Maharashtra’s share was only 10 per cent in 1990-91. Kerala holds 4th position in cashew production.
2.25 In spite of operating special schemes for expansion of area under cashew, the coverage has been steadily declining during the last two decades except in 2011-12. Productivity of the crop, which was around 900 kg.per ha. during late eighties has also started declining from 1995-96 onwards, reaching 562 kg. per ha. during 1998-99 and thereafter hovering around 800 kg. In 2011-12, it further declined by 14 per cent (680 kg. per ha) over the previous year. Details are given in Appendix 2.15
Plantation Crops
2.26 Plantation crops in general are either export oriented or import substituting and therefore assume special significance from the national point of view. It is estimated that nearly 14 lakh families are dependent on the plantation sector for livelihood. Each of the four plantation crops of South India has its distinct characteristics and economic problems. Consequent to the removal of quantitative restrictions on import, plantation crops in general are facing the threat of low quality imports.
2.27 Kerala has a substantial share in the four plantation crops of rubber, tea, coffee and cardamom. These four crops together occupy 7.02 lakh ha, accounting for 34.4 percent of the net cropped area in the state. Kerala’s share in the national production of rubber is 87.3 per cent, cardamom 79 per cent, coffee 22 per cent and 7 percent in tea during the year 2011-12.
Rubber
2.28 In Kerala the coverage under the crop in 2011-12 was 5.39 lakh ha, higher by 5335 ha. over the previous year. The production of natural rubber in Kerala during the period was 7.89 lakh tonnes indicating 2.4 percent increase over the previous year. In 2011-12, the productivity increased slightly to 1462 Kg/ha from 1442 Kg/ha in 2010-11. 87.3 percent of total rubber production in the country was from Kerala in the current year of 2011-12.
2.29 The production of natural rubber in the country was 9.04 lakh tonnes in 2011-12, registering a 4.9 per cent increase compared to 2010-11. The growth in production was attributed by favourable climate and attractive price. India continued to be in the first position in the world in productivity during 2011-12 also which increased to 1841 kg/ ha from 1806 kg/ha during 2010-11 in terms of yielding area. The total consumption of natural rubber in 2011-12 was 9.64 lakh tonnes with a growth of 1.8 percent as against 9.47 lakh tonnes during 2010-11. The import of Natural Rubber in the country up surged to 2.14 lakh tonnes in 2011-12 from 1.90 lakh tonnes in 2010-11. While export of Natural Rubber during 2011-12 declined to 27145 tonnes from 29851 tonnes in the previous year.
2.30 The global Natural rubber production was also marked an increase of 5.75 lakh tones in 2011-12 and estimated at 109.74 lakh tonnes, which was 103.99 lakh tonnes in the previous period. All the major producing countries reported increase in crop, led by Thailand with a share of 30.9 percent share in the total world production, followed by Indonesia (27.2%) and Malaysia (9.1%). India hold only 4th position (8.1%) in this regard. Details are given in Appendix 2.16 to Appendix 2.19
Coffee
2.31 The area under coffee in Kerala was 0.84 lakh ha out of 4.09 lakh ha in the country during 2011-12, which works out to around 21 per cent. The percentage share of area under coffee is highest in Karnataka ( 56.1%). The share of Kerala in production is around 22 per cent during 2011-12. Major variety grown in Kerala is Robusta with a share of 97.1 per cent in planted area. Production of coffee during the year was only 0.68 lakh MT against 3.14 lakh MT for the country. Productivity of the crop in terms of bearing area in Kerala is 808 kg/ha which is lower than the national level of 852 kg/ha during 2011-12. Even though the area under coffee registered a slight decline during the period, the production has recorded 3.8 percent increase as against the previous year. Domestic coffee production for the year 2011-12 is more than 0.12 lakh tonnes compared to the previous year. Among the States, Kerala stands next to Karnataka which produces 70.4 percent of total coffee production.
2.32 Global coffee production during 2011-12 was estimated at 131.9 Million bags compared to 134.2 Million bags in the previous period. The decline in crop was reported from South American countries mainly Brazil(-4.6 Million bags) and Columbia(-0.7 Million bags). Brazil’s position remained top in the world coffee scene with a share of 33 percent even there is a fall in the crop during the period. Vietnam occupies 2nd position with 15.2 percent share and Indonesia (6.3%) retained its 3rd place in the world coffee production. India slipped to seventh position (4%) , despite increase in production.
Tea
2.33 Against the total area of 5.8 lakh ha under tea in the country Kerala accounts for only 0.37 lakh ha 2011-12. Area under South India is estimated as 1.2 lakh ha in the period. In respect of total production of tea in India, the share of Kerala is 6.9 percent in 2011-12. There is a slight increase in production of tea in Kerala and it ranged from 0.57 lakh MT in 2010-11 to 0.58 lakh MT in 2011-12.
2.34 During 2011-12, slight increase in world tea production was reported i.e.,4217.1 M.kg. compared to 4162.5 M.kgs in the previous year. This increase was recorded from the two major producing countries, viz. China (74.9 M.Kgs) and India ( 21.9 M.kgs). In India, tea production during 2011-12 was placed at 988.3M.kgs against 966.4 MKgs in the previous year. During this period, the share of India is 23.4 percent in the World tea production, occupying 2nd position after China
(36.8% ) . Details are given in Appendix 2.20
Cardamom
2.35 Kerala accounted for a major share (78.8% ) in the total cardamom production in the country. Karnataka and Tamilnadu contributed 14.7 percent and 6.5 percent share respectively. In Kerala, the area under cardamom is 0.42 lakh ha comprising 59.2 percent of total area of crop in the country during 2011-12. The production has increased from 0.08 lakh MT to 0.10 lakh MT in the respective year.
2.36 The price of cardamom in domestic market was र 1013 per kg. in 2010-11, which further declined र 614 per kg. in 2011-12 and slightly increased to र 677.59 per kg in February 2013. Remunerative prices are required for the development of crop in the state.
2.37 During 2011-12, India produced 12.98 thousand tonnes of Cardamom with an increase of 2.60 thousand tonnes compared to 10.38 thousand tonnes in the last year. Area under cardamom in the country is 0.71 lakh ha during this period. Details are given in Appendix 2.21
Collective Farming through Kudumbashree
2.38 Collective farming is an important area of Kudumbasree which aims at food security both at houseold and community level. From 2010 onwards collective farming groups were organised as Joint Liability Groups (JLGS). Total number JLGs during this period was 6116 and cultivated 9912.07 ha in 2011-12. The major crops cultivated are paddy, vegetables, banana, pineapple and tubers. Area brought under cultivation of paddy was 3838.06 ha, vegetables contributed to 1352.524 and 4721.49 ha of area was covered by other crops (banana, pineapple and tubers). Details of area covered are depicted in Appendix 2.24. More hand holding support including facilitation with banks and technology support are essential for improving livelihood of the women groups involved in farming.
Key Initiatives of the Department of Agriculture in 2012-13
2.39 The key initiatives of the Department of Agriculture in 2012-13 for the improvement of agriculture sector are shown in box 2.1. The introduction of farmer registration and E- payment system are expected to streamline delivery system in agriculture. The physical target oriented implementation at panchayat level initiated for vegetable development. Implementation of physical target oriented scheme implementation needs to be introduced for all major schemes. More proactive steps are required for the implementation of extension schemes and value addition projects. Pilot projects for the implementation of income security also to be prepared. The bill for the setting up of Farm Welfare Fund Board also to be introduced in the Assembly. The new initiatives coupled with services notified under Service Delivery Act 2012 are expected to revitalize the agriculture sector of the State.
Box 2.1
Key Initiatives in 2012-13
l Initiated farmer registration and 14.69 lakh farmers registered with the Krishi Bhavans upto
November 2012.
l E- payment system introduced for providing assistance to farmers.
l Agro service centres started in 35 blocks through the department Agriculture and another
40 Farmer Service Centres through Co operation department.
l Hi tech agriculture focussing on polyhouse based vegetables and flower production and
open farming initiated. Implementation is progressing with construction of 667. polyhouses
l Steps initiated for the establishment of two rice bio parks and coconut bio park.
l Comprehensive vegetable development project is under implementation with focussed activities in 55
blocks.
l Mobility support provided to Krishi Bhavans.
l Restructured procurement initiated for coconut.
l Paddy procurement price increased and streamlined the procurement operations in all
districts.
l Implementation of Agricultural Technology Management Agency (ATMA) Plus for extension
initiated in all districts.
l Establishment of Farmer Welfare Fund Board is in the early stage of implementation for the
consolidation of the all welfare schemes of farmers.
l Physical target oriented implementation at panchayat level initiated for vegetable development.
l Initiated setting up of two incubation centres at National Institute for Interdisciplinary Science
and Technology (NIIST) and Central Tuber Crops Research Institute (CTCRI) for value
addition and initiated implementation of value addition projects through Small Farmers
Agri Business Consortium (SFAC)
l Revised strategic Research and Extension Plan prepared in all the districts for XIIth Five Year Plan.
Crop Development Programme - Review of Annual Plan 2011-12
2.40 During the Annual plan 2011-12 an amount of र 210.75 crores was provided to crop husbandry which include partially aided schemes and 100 percent Centrally sponsored including central release of SHM. Expenditure incurred under crop husbandry and agriculture research amount to
र 245.33 crore, which constitute 96 percent of the outlay. A major scheme wise financial achievement made during the period is furnished in Appendix 2.25. An amount of र 28.98 crore was utilized for the development of rice in the State. The ultimate objective of rice development programme is to improve the production of rice and to attain the productivity of a minimum of 3 tonnes per ha by the end of the XIIth Plan period. Paddy cultivation is mainly undertaken by the Group Farming Samithies. It is estimated that about an area of 1.75 lakh ha is under about 6850 group farming smithies. In food security project the following are the achievements under rice development. An area of 1.72 lakh ha was covered under group farming by utilising an amount of र 28.68 crores. Under fallow land cultivation, an area of 3407 ha has been treated and upland cultivation was done in an area of 6539 ha by utilising an amount of र 327 lakh. Wadakkanchery model rice cultivation has been implemented in 12 blocks covering an area of 3000 ha by expending an amount of र 498 lakh. Under comprehensive coconut development programme, an area of 10,209 ha has been covered and 408 coconut clusters were formed for improved cultivation.
2.41 For the development of vegetables, commercial vegetable cultivation was undertaken in 2940 ha by utilising an amount of र 260 lakh, school gardens in 500 schools and distributed 25 lakh vegetable seed kits, establishment of 347 organic villages etc. are the main activities. Under pepper development programme in Wayanad, 2358 ha area was covered by expending an amount of र 6.45 crore (99%) against the outlay of र 6.5 crore . Purchased 50 numbers of harvesting machines under 1st phase of Kuttanad package. The project for strengthening extension –‘LEADS’ was initiated in Kollam, Kannur and Palakkad districts
Major Achievements during XIth Plan.
2.42 The outlay provided to crop husbsandry, agriculture marketing and other agriculture programmes during XIth Plan was र1334.84 crore and the expenditure reported was र1257.74 crore (94%). A project on state food security launched in 2008-09. A convergence approach was followed and local governments also supported the initiative. The total outlay for this programme during the plan period was र 92 crore of which र 87.46 crore was expended. The Kerala state Farmers Debt Relief Commission has been set up and functioning in the state since 9-04-2007. The Commission had received 4.11 lakhs application and total amount received was र 112.55 crore. A pepper package was introduced in Wayanad district for the rehabilitation of pepper through a combination of technological and institutional framework.
2.43 A network of markets and associated infrastructures like godown, cold storage facilities including processing infrastructure were set up during the period and for that an amount of र18 crore was utilized. Major scheme wise expenditure is given in Appendix 2.26
Horticulture Mission
2.44 The mission aims at addressing problems related to generation of technology, production, post harvest management, processing and marketing under one umbrella in the horticulture sector. A total amount of र 7118 lakh was released during 2011-12 and the total expenditure was र 7349.36 lakh including state share. A project oriented monitoring system has to be evolved for realizing the envisaged outputs. A number of NGOs as well as private sector are also part of the project which needs further monitoring. More convergence of schemes with state plan and RKVY with deliverable are required for improved outputs. Details are given in Appendix 2.27
Vegetable and Fruit Promotion Council’s Programme
2.45 During the year 2011-12, 9280 farmers were inducted and 515 new SHG’s were formed for the promotion of fruits and vegetables. The council had initiated 14 new farmer markets and 23 collection centres during the financial year.
Rashtriya Krishi Vikas Yojana (RKVY)
2.46 During 2009-10,an amount of र 110.92 crores was sanctioned ,out of which र 30 crore was meant for the implementation of projects sanctioned during 2008-09. The expenditure was only
र 105.69 crore in the respective period. During 2010-11, an amount of र 149.65 crore was released and total expenditure was र148.70 crores. During 2011-12, र 154.38 crore was expended out of the allocation of र 182.89 crore.
2.47 An amount of र 282.26 crore was allocated during 2012-13. The share of allocation for Kerala is very low compared to the budget provision for the country. A number of very small schemes are included for assistance under RKVY in the state. More focused areas with larger projects have to be identified for support under RKVY. The preparation of district and state agriculture plans are a prerequisite for getting assistance for which concrete steps are required. Most of the documents prepared are a compilation of proposals for assistance under RKVY. The state Agricultural plan also has to be prepared for availing assistance under RKVY. More integrated approach is required for RKVY linkage with state plan. Details are given in Appendix 2.28
Support to State Extension Programme
2.48 Even though a convergence approach is envisaged in the scheme on extension reforms, more needs to be done to realize the objectives. The extension system needs a thorough restructuring. The total expenditure under ATMA during 2011-12 was र 957.20 lakhs. The newly introduced lead farmer centered extension advisory and delivery service (LEADS) to be implemented under the ATMA frame work, with field visit on a regular basis in more districts after the evaluation of the pilot phase. All extension schemes components under ATMA Plus needs to be implemented in XIIth Five Year Plan with more convergence of schemes under Animal Husbandry, Dairy and Fisheries.
Crop Insurance
2.49 Under National Agriculture Insurance Scheme (NAIS) Paddy ,Banana, Tapioca, Ginger, Turmeric & Pineapple were notified for Kharif Season & Paddy ,Banana ,Plantain & Tapioca for Rabi Season. Around 30435 farmers were insured covering an area of 31570 Ha .In 2011-12 र146.52 Lakhs were paid as claims. Under Weather Based Crop Insurance Scheme (WBCIS) being implemented on pilot basis, the State Government has notified Paddy in Palakkad District, Cashew in Palakkad, Kasargod, Kannur and Kozhikkode Districts and Pepper in Idukki and Wayanad Districts during 2011-12. In this Scheme 4681 farmers were enrolled under the Scheme covering an area of 5899
ha. In 2011-12 र 42.50 Lakhs were disbursed as claims under WBCIS. More crops and areas are to be covered under WBCIS after ensuring automatic weather station network. Appropriate region specific technical parameters also need to be developed.
2.50 Coconut Palm Insurance Scheme(CPIS) is being implemented presently in Thiruvananthapuram, Alappuzha, Ernakulam and Kozhikkode. In 2011-12 40,429 farmers were insured covering an area of 17693 ha .Around 118 Lakhs were disbursed as claims benefiting 2725 farmers. An evaluation study of Coconut Palm Insurance Scheme (CPIS) has been done by International Centre for Economic Policy and Analysis (ICEPA). The salient findings of the study with respect to Kerala are given in the Box 2.2
Box 2.2
Evaluation Study of Coconut Palm Insurance Scheme (CPIS)
In Kerala, the scheme is implemented in the districts of Thiruvananthapuram, Alappuzha,
Ernakulam and Kozhikkod jointly by Coconut Development Board(CDB), Department of Agriculture and Agriculture Insurance Company. A total of 1864 growers were insured under CPIS in Kerala during 2010-11. A number of 64565 palms are insured under the scheme out of this 10303 palms are under the age group of 4-15 years whereas palms 54262 fall under the age group of 16-60 years in Kerala. Total premium received under the scheme is र 376854 with farmers paying a premium of र 94212 and CDB and the State Government are providing a subsidy of र 188426 and र 94213 respectively for the CPIS scheme during 2010-11.
• Drawbacks identified
Insufficiency in compensation is the main drawback identified with CPIS in the state. Due to complexities in terms and conditions of the scheme, the CPIS is found to be ineffective in the state. Franchise limit is another major drawback identified in the study. All the palms are not covered under the scheme. Limited time bound for claiming and difficulty in procedures are another drawbacks found. There is a lack of communication between farmers and authorities and lack of information about the scheme to the farmers.
• Suggestions
The compensation amount may be increased and new palms may be subsidised. Hundred per cent compensation may be paid to the farmers. Lump sum premium payment may be allowed for more tenure. The franchise limit may be removed and all the palms may be covered under the scheme. Claim procedures may be simplified and claiming period may be increased.
Information on CPIS may be given and follow ups may be done by AIC and the CPIS scheme should be popularised
Source :Report of Evaluation of Coconut Palm Insurance Scheme ( CPIS), International Centre for Economic Policy and Analysis (ICEPA), 2012
Fertiliser Price
2.51 Fertiliser nutrient consumption in Kerala, though much less than the national average, shows steady increase over the years. N consumption was at a faster pace than the other two , followed by P and K. The rate of growth in intensity of application was nearly double that of total consumption In 2007-08 the total fertilizer consumption (in lakh tonnes) was 2.08 which increased to 2.60 in 2008-09 and then to a peak value of 2.83 in 2010-11. However in 2011-12, the consumption has dropped down to 2.53 lakh tonnes of N,P and K with an intensity of application at 95.10 kg per hectare of total cropped area which could be related with exorbitant hike in fertiliser price. The consumption level of N is at the highest (46.9%) followed by potash (32.465%) and Phosphorous(20.66%) during 2011-12. Soil test based nutrient application including micro and secondary nutrients is to be popularised to save excess application of costly nutrients and to improve productivity.
2.52 The fertilizer price increase during the 19 year period from 90-91(during the RPS regime),was estimated to be to the tune of 4.53 percent,the highest rate of 8.09 percent in the case of P, followed by K and N. The policy shift towards NBS, the oligopolistic nature of global fertilizer market, rising petroleum prices, growing share of private sector and our heavy dependence on imports foretell an imminent and steady rise in future fertilizer prices. The Government implemented Nutrient based subsidy (NBS) policy from April 1, 2010 onwards. After the introduction of NBS policy in April 2010, which moved from fixed price floating subsidy regime to fixed subsidy floating price, the prices of phosphatic and potassic fertilizers registered sharp increase particularly during the last one year. In the case of Muriate of Potash (MOP), prices witnessed a very sharp increase in the post NBS period and the price of MOP increased from र 4455 per MT in March 2010 to र 12000 per MT during 2011-12. The price again steadily increased to about र 17000 per MT in June 2012. This increase is to the tune of nearly 280 percent of its price in March 2010. Similar increase happened in case of phosphatic fertilizers also. The cost of factomphos in Kerala , which is the most common fertilizer was
र 6295/MT in March 2010 which increased to र 18691/MT in September 2012., indicating 197percent increase.
2.53 This is a serious issue in Kerala’s agriculture where cash crops are cultivated. The farmers are not compensated by any higher procurement prices since major crops from Kerala are out of procurement. A decline in fertilizer application and a likely long term decline in production and productivity of crops and ultimately the livelihood of farmers need to be considered in designing policy options.
Expansion of Hi-Tech Agriculture
2.54 The promotion of high tech agriculture covering protected agriculture and open precision farming was initiated in 2012-13 as part of vegetable initiative. It is expected to construct about 667 polyhouses in 2012-13 and early phase of 2013-14 and another 21 demonstration units. Several biotic and abiotic stresses are the major factors responsible for low productivity and poor quality in large number of vegetable crops. Protected cultivation structures with partially modified environment are useful for combating both biotic and a biotic stresses that limit the productivity and quality of produce, and also for production throughout the year. The area under protected cultivation in the country is about 2000 ha at the end of 2011 while it is reported 20 lakh ha in China.
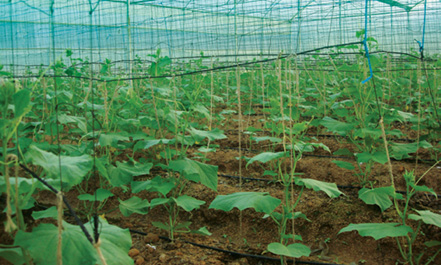
2.55 Tomato and bell pepper are estimated to have touched 300 tonnes & 200 tonnes / ha / year and those of cucurbits 80 to 100 tonnes/ha/crop. Raising of high quality seedlings, insect proof net houses, technical support, soil and water quality testing facilities, availability of hybrid seeds and water soluble fertilizers at reasonable cost and marketing network are a prerequisite for the success of the project. Standardization of low cost structural designs to green houses for different agro climatic zones of the State, development of agro techniques, biological control of pests are the key challenges in promoting high tech agriculture. The project needs to be reoriented to benefit the poor and marginal farmers from limited land area.
Value Addition and Agro Processing
2.56 The development of value addition and agro processing is a crucial area in achieving sustainable agricultural production by ensuring better remuneration for farmers. 2 percent of horticulture produce are processed while more than 35 percent of fruits and vegetables are wasted due to lack of storage and processing facilities as reported by the Varma Committee in 2008 in the country. The development of secondary agriculture in compassing all food and non-food bio resource based products for human and individual use is crucial for the redijalu of remunerative prices for farmers. Constraints in supply and delivery item, poor capacity utilization, shortage of power and trained man power, obsolete and inefficient processing equipments, inadequate technologies, absence of cold chain, precooling of freshly harvested produce, waxing, packaging, technology for ripening of the fruits under controlled conditions, implementation and co-ordiantion mechanism and development of incubation centres are to be addressed for the promotion of agro processing. The Small Farmers Agri Business Consortium and KINFRA in association with research institutions will be able to provide a facilitating role for the development of the sector. More co-ordinated and proactive steps from the department of Agriculture and Industry are required. The two incubation centres established in 2012-13 at CTCRI and NIIST and value addition projects initiated through SFAC needs to be upscaled. The future growth in agriculture is likely to come increasingly from the high value sector and agroprocessing.
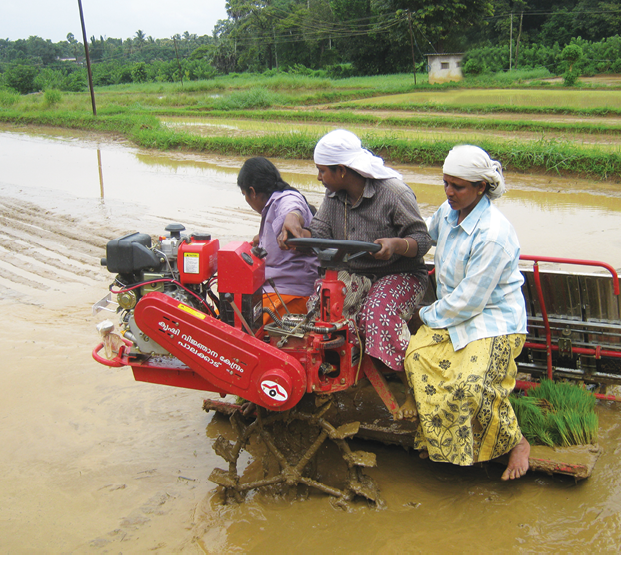
Farm Mechanisation
2.57 Inadequate availability of agriculture labour and the resultant farm wage increase forces farmers to seek labour saving devices to remain competitive. Past efforts to accelerate the use of mechanization have produced unsatisfactory results. A new initiative and perspective to address mechanization issues is urgently required. Farm mechanization has been biased in favour of field crops in the state while there is considerable scope for expansion of mechanization in garden land agriculture.
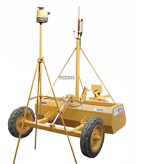
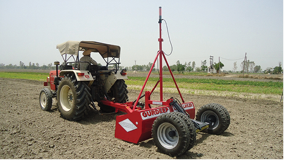
Laser Land Leveller
Levels and types of improved mechanical technologies need to be appropriate, compatible with local agronomic and socio economic conditions. One of the major reasons for the low penetration of mechanization has been the fragmented approach to mechanization issues. Strategic regional plan would bring about the critical mass that is needed to make machinery contractual services viable. Along with the required machines support services including supply of parts is essential for the sustainability of the mechanization initiative. Private-public-panchayat-co-operative partnership is an ideal model for expansion of mechanization in Kerala. The 35 agro service centers established by the department of Agriculture and 40 Farmer Service Centers established by the co-operation department at block level are expected to act as facilitation centers. The initiatives of KAICO & KAMCO also to be consolidated along with the technical support of the agricultural engineering wing of the department of Agriculture. Gender friendly implements, implementation of garden land agriculture, urban agriculture as well as high tech farming are to be developed and popularized.
Strengthening of Plant Health Management
2.58 In spite of success in controlling the crop pests, pesticides adversely affect public health and environment. Residues of pesticides in food crops often been reported to exceed their acceptable limits. Many new pests which were controlled by their natural enemies present in the ecosystems have assumed the status of the major pests in some regions due to decline in the population of the natural enemies caused by the indiscriminate and excessive use of pesticides. Many interventions are aimed at supporting pest control often relying solely on the application of pesticides or the use of resistant/tolerant cultivars. In the longer term this has been shown to be unsustainable as a result of pest overcoming host plant resistance and building up resistance to pesticides or the improper and or excessive use of pesticides with undesirable impact on human and ecosystem. A rethinking seems essential on the approach and strategies of pest management in Agriculture focusing on Agro ecosystem and human health evolved out of sound plant health management interventions. The new approach of plant health management will bring together management towards sustainable ecosystems and people’s health through Good Plant Protection Practices (GPPP).Pest management strategies need to recognize that plant health is an essential element of sustainable agriculture. Improvements in integrated pest management can lead to sound crop health management. Department of Agriculture has a prestigious bio control lab at Mannuthy, Thrissur and the capacity of the lab is to be further strengthened.
2.59 A major problem faced by the farmers of Kerala is the attack by various pests and diseases in all cultivated crops. It is a known fact that the incidence of pests and diseases varies with weather, soil and ecology and a through understanding of this variation is inevitable. Kerala State Planning Board has published the Agro Ecological Zone Series Bulletin No. 1 which comprehensively cover the insect pest and disease incidence of major crops in the state along with Adoption Indices of plant protection practices in different Agro Ecological Units (AEU)of the state delineated by NBSS & LUP Bangalore. The salient findings of this publication is summarized in the Box.2.3
Box 2.3
Agro Ecological Zone Series- Bulletin No.1
Disease and Insect Pest Incidence and Adoption Indices of Plant Protection Technologies in Major Crops of Kerala in different Agro Ecological Units-District wise Analysis
• In case of coconut, root wilt and leaf rot are major problems in Kerala except in AEUs of
Northern Districts. Mites and rhinoceros beetle are found to be major pests affecting coconut
throughout the state.
• In all the rice growing AEUs, blast disease was found to be a serious issue except in Palakkad.
The incidence was however very less in Pokkali lands and high hills of Ernakulam district. In
Kuttand tracts blast followed by leaf blight and sheath rot are major diseases of rice. In southern
coastal and Onattukara region, rice bug is a menace. In Kollam, Malappuram and Kasaragod
districts stem borer infestation is a serious problem in rice.
• In pepper, quick wilt and pollu beetle attack are higher in Thiruvananthapuram, Palakkad,
Kozhikkode, and Kannur Districts. In Idukki, Pathanamthitta and Wayanad districts quick wilt is the
most serious disease in pepper.
• In all districts except Idukki, fruit fly is found to be devastating the vegetable crop. In Alappuzha,
Malappuram and Kozhikkod districts, leaf spot disease is more serious in vegetables.
• There is lesser adoption of fungicide application and biocontrol measures for pest management
in rice crop in Thiruvananthapuram district.
• In Ernakulam and Thrissur districts adoption of plant protection chemicals is generally lesser.
In Alappuzha district, Adoption Index for plant protection measurers is higher among rice
farmers but low among coconut farmers.
• In Kottayam district Adoption Index for insecticides and fruit fly traps are higher in vegetables.
In areas cultivating cool season vegetables in Idukki District, Adoption Index for insecticide
application is higher.
• In foot hill and high hill regions of Kollam District fruit fly traps are largely adopted for vegetable
cultivation compared to other southern districts and AEUs of Palakkad and Kozhikkode districts
have better adoption of fruit fly traps than other northern districts.
• Except Kollam, Malappuram and Palakkad, all the districts have poor adoption of bio control
measures for pest and disease management.
• Redefining the crop management strategies analysing the problems and prospects to the level
of Agro Ecological Unit appears to be the best solution to achieve higher productivity in the
state.
Source : Agro Ecological Zone Series-Bulletin No.1, Disease and Insect Pest Incidence and Adoption Indices of Plant Protection Technologies in Major Crops of Kerala in Different Agro Ecological Units- District wise analysis, Kerala State Planning Board, Govt. of Kerala 2013.
2.60 Scaling up of safe to eat interventions in food crop production, organic agriculture in feasible areas in a phased manner, area wide crop health management projects focusing on major crops of the state, electronic pest surveillance, strengthening diagnostic systems, biocontrol production units, establishment of pesticide residue testing laboratories, development of early warning systems, safe pesticide application equipments and capacity building are essential to implement plant health management project in a systems perspective for achieving good plant health leading to good human health and health of the ecosystem.
SECTION- 2
Livestock Development
Trend in Production of Major Livestock Products
2.61 The dairy sector in Kerala could maintain a higher growth rate of 4.2 percent in the 1990s, compared to the national level of 4.2 percent, in spite of a weak fodder base. During the period 2002-03 to 2006-07 ( Xth Plan Period), a negative growth rate was recorded in the milk production of Kerala (- 4.6%) from 3.7 percent in IXth Plan and at all India level the growth rate declined to 4 percent from 4.3 percent in IXth Plan period. For the period 2007-08 to 2011-12 a recovery has been marked in milk production of Kerala with an average annual growth rate of 5.1 percent. This is reasonably high rate compared to 4.4 percent at all India level.
2.62 Total milk production in the state which was 24.2 lakh tonnes in 2003 declined to 21.1 lakh tonnes in 2004 and increased to reach 27.2 lakh tonnes in 2011-12. At the same time, over the period, at national level the milk production has been continuously increasing. Contribution of Kerala to national milk production which was 2.4 percent during 2003-04 showed a declining trend and reached to 2.1 percent during 2011-12.
2.63 Egg production in Kerala achieved an average annual growth rate of 7.4 percent during 2007-08 to 2011-12 period. At all India level, the growth rate was 5.3 percent during the period. India ranks third in egg production in the world as per FAO STAT data for the year 2010. The average annual growth rates of milk and egg production in Kerala and India for the period from 2002-03 to 2011-12 are given in Table 2.3 and year wise estimate of production of milk, egg and meat, from 2007-08 onwards are given in Appendix 2.39
Table 2.3
Average Annual Growth Rate of Milk and Egg Production
Sl.No. |
Year |
Milk | Egg | ||
| Kerala | India | Kerala | India | ||
| 1 | 2002-03 to 2006-07(Xth Plan Period) |
-4.64 | 3.99 |
-4.86 |
5.59 |
2 |
2007-08 to 2011-12(XIth Plan Period) |
5.11 | 4.40 |
7.40 |
5.27 |
| 3 | 2011-12 | 2.76 | 4.97 | 1.14 | 5.52 |
Source: Animal Husbandry Department
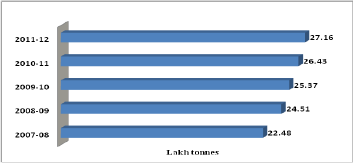
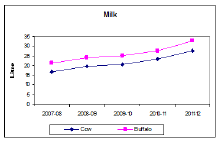
2.64 India continues to be the largest producer of milk in the world with a total production of 127.90 million tonnes in 2011-12. India’s contribution towards world milk production in 2010 was 16.2 percent. Among the major states in India milk production is highest in Uttar Pradesh(225.56 lakh MT) followed by Rajasthan(135.12 lakh MT) and Andhra Pradesh (120.88 lakh MT). Kerala ranks 13th position with 27.16 lakh MT. Though India is the largest producer of milk in the world the per capita availability of milk is low compared to developed countries. Substantial increase in this regard was attained over a period of 10 years, from 225 gm/day to 281 gm/day. Trend in year-wise milk production of Kerala for the period from 2007-2008 to 2011-12 (XIth Plan) is given in Fig.2.6.
Fig. 2.6
Milk Production of Kerala (2007-08 to 2011-12)
2.65 In spite of India’s position as highest producer of milk, productivity per animal is very poor. At the national level it is only 987 Kg/lactation as compared to the world average of 2038 Kg/lactation. This is mainly due to poor level of nutrition as well as low genetic potential for milk production and health care. Among the major states in India, there are significant interstate differences in the productivity of cows and buffaloes. As per the available estimates milk yield/day of exotic cows were highest in Punjab(8.431 Kg), followed by Gujarat (8.057kg) Kerala(7.508 kg) and Andhra Pradesh (7.385kg). At the same time the yield/day of exotic breeds in Karnataka is 6.312kg and Tamil Nadu is only 5.890kg. Among these states highest yield of non descript cow is of Gujarat (3.401kg) followed by Tamil Nadu(2.762kg), Kerala (2.629 kg), Punjab (2.505kg), Karnataka (2.240kg) and Andhra Pradesh (1.813kg). The average yield/day of buffaloes is highest in Punjab (7.425 kg) followed by Kerala (6.242 kg), Tamil Nadu (4.222 kg) and Karnataka (2.481 kg). In general the milk yield of both cows and buffaloes were lowest in Assam.
2.66 Comprehensive dairy development projects need to be prepared to augment milk production in the state covering the potential milksheds. Integrated diary development projects also to be prepared for implementation under Idukki package, Wayanad and the potential districts with appropriate components on infrastructure development, technology and credit support.
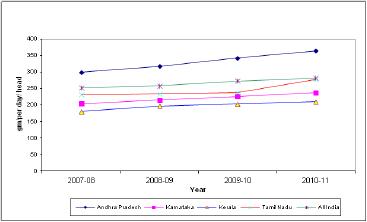
2.67 Regarding the per capita availability of milk based on 2010-11 figures for the southern states viz., Andhra Pradesh, Karnataka, Tamil Nadu and Kerala, Andhra Pradesh ranks first with an availability of 364g/day and Tamil Nadu ranks second with 278gm/day. Among the four states, Kerala has the lowest figure of 210gm/day (See Appendix 3.41). Among the major states at all India level Punjab ranks first with 937gm/day and the lowest in the case of Assam with 71gm/day. Per capita availability of milk at all India level was 281 gm/day (Figure 2.7)
Fig. 2.7
Trend in Percapita Availability Based on Production of Milk in Four Southern States and all India (2007-08 to 2010 - 11)
2.68 The National Dairy Plan phase -1 is prepared to be implemented during the period 2011-12 to 2016-17.The total outlay of the first phase is र 2242 crore. Kerala is expected get significant support from the National Dairy Plan.
Milk Marketing
2.69 During 2011-12 a total of 4518 lakh litres of milk was procured by the DCS in the state of which 2834 lakh litres were sent to the dairies and 1684 lakh litres were marketed locally by the societies. The procurement by the DCS is only about 15-16 percent of the total estimated production during 2011-12.
2.70 MILMA represents more than 8.60 lakh dairy farmers through more than 3000 Anand Pattern Co-operative Societies by March 2012. Under KCMMF there are 13 milk processing plants with a combined processing capacity of 11.40 lakh litres per day and 7 milk chilling plants support the procurement of milk. The average milk procured per day by APCOS during the year 2011-12 was 787 MT against the previous year average of 656 MT.The procurement /day/society during 2011-12, 344 litres and during 2010-11 it was 305 litres. The Federation is importing milk from the neighboring states during lean periods when the internal supplies used to shrink. The procurement of milk by dairy under KCMMF stood at 2865.93 lakh litres against the sale of 4297.03 lakh litres during 2011-12 showing a wide gap between procurement and supply. Data on procurement and sale of milk by different dairies of KCMMF during 2007-08 to 2011-12 is given in Appendix 2.44 and performance of KCMMF 2007-08 to 2011-12 are furnished in Appendix 2.45. The average quantity of milk procurred per day by APCOS (1997 to 2012) is given in Appendix 2.46
2.71 The procurement and selling price of milk has been revised in Kerala w.e.f 14.10.2012. The average quality of milk procured in the state is 4.1 percent fat and 8.3 percent SNF and the procurement price paid for the same is र 28.61 per litre and sales price for toned milk is र 33 per litre. Price revision details of milk and price spread of milk from 2008 onwards is given in Appendix 2.47 and Appendix 2.48 respectively.
Egg and Meat
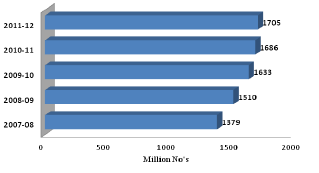
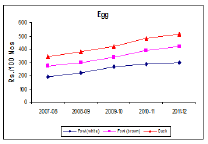
2.72 The gap between the production and requirement of egg is increasing at an alarming rate.
Concerted efforts of the State to increase the egg production have begun to show signs of improvement. Poultry farming for egg production with purchased feed are uneconomic in Kerala. Poultry rearing on commercial lines is therefore largely confined to broiler production. The egg production which was 2054 million in 1999-2000 continuously declined till 2005-06, but began to increase in 2006-07 and that trend maintained in succeeding years. Compared to previous year egg production increased from 1686 million numbers to 1705 million in 2011-12; an increase of 1.1 percent over the previous year. The per capita availability of egg per annum in Kerala during 2011-12 was 51
numbers compared to 50 numbers in 2010-11.
2.73 Though meat production is increasing over the years, it cannot cater to the demand fully. Poultry meat production increased from 16153 tonnes in 2010-11 to 1,84,000 tonnes in 2011-12 and meat other than poultry meat from 108398 tonnes in 2010-11 to 242000 tonnes in 2011-12 registering an increase of 1039.1 percent and 123.3 percent respectively over the previous year. The per capita availability of meat per day in Kerala during 2011-12 was 35 gms (Poultry meat 15 grm and meat other than poultry meat 20 grms). Kerala has not exploited the potential of meat production.
Regional projects with appropriate buyback arrangement have to be prepared for the improvement of meat production in the state. Trend in Egg production during the period from 2007-08 to 2011-12 is given in Fig. 2.8.
Fig.2.8
Egg Production of Kerala (2007-08 to 2011-12)
Backyard poultry
2.74 Backyard poultry system has good potential in the state where in the cost of production is less and also help to convert unconventional feed in to value added protein. A comprehensive project needs to be prepared in association with local governments for the promotion of backyard poultry with appropriate forward and backward linkages to achieve the full potential of the sub sector to consolidate the ongoing schemes implemented by the KSPDC and the Department of Animal Husbandry.

Fodder Weak Feed and Fodder Base
2.75 It is estimated that the state produces only 60 percent of the roughage requirement for cattle in Kerala. Special focus has been given to fodder and feed production in Kerala to overcome the situation during the five year plan periods.Perennial fodder varieties like Hybrid Napier and Guinea are widely acceptable to farmers, and the department is supplying the planting material free of cost to the farmers. Fodder and feed development is of prime importance in reducing cost of production and optimising economic return from the dairy activity and KLD Board and dairy development department have taken up fodder development as an important activity right from the beginning. The quantity of seeds supplied by KLD Board during the period under report was 85.41 MT against 79.31 MT during 2010-11. Details of production and sale of fodder seeds by KLD Board from 2004-05 onwards are given in the Appendix 2.50. Proactive steps are required to supply new varieties from the Universities and other research institutions for cultivation through societies. Block level fodder plan have to be prepared to utilize all potential areas including coconut garden for fodder planting.
2.76 Kerala farmers have adjusted to the situation by restricting the number of cattle and that too by preferring to maintain high yielding cross breeds. This is evident from the steady increase in the proportion of crossbred animals, which Kerala achieved during the last three decades. (see Appendix 2.32).
2.77 During 2011-12, under department programmes perennial fodder cultivation was extended to 2599 ha and short term crops were cultivated in 365 ha, resulting in the additional production of 5.5 lakh M T of fodder in the state. Details of supply of Fodder seeds/ Root slips by Dairy Department and area covered under fodder cultivation during the last five years are given in Appendix 2.62
Cattle Feed
2.78 During 2011-12, the two plants under KCMMF produced 1.2 lakh MT of cattle feed and sold 1.2 lakh MT. The major customers are APCOS (76%) and Government (16%). The production of cattle feed by Kerala Feeds Ltd., slightly increased to 2.2 lakh MT in 2011-12 from 2.0 lakh MT in 2010-11.The quantity sold also increased from 2 lakh M.tonnes in 2010-11 to 2.2 lakh MT in 2011-12. The Company has a good marketing network which includes 400 dealers and 450 Co-operatives. Of the total sales 47.4 percent was to dealers, 30.7 percent to APCOS and 16.8 percent to Government. During the review period the production of mineral mixture stood at 203 MT against 137.5 MT during 2010-11. Production details of the above cattle feed plants are given in Appendix 2.55. Setting up new cattle feed plant as well as augmenting the capacity of existing plants are essential. Availability of cattle feed at reasonable cost is a prerequisite for the success of dairy development in the state.
Breeding Support
2.79 Kerala Livestock Development Board (KLDB) is involved in the production and distribution of frozen semen. Compared to 2010-11, semen production increased from 16.9 lakh doses to 24.1 lakh doses during 2011-12. The distribution inside and outside the State increased from 17.4 lakh doses to 17.6 lakh doses and from 3.0 lakh doses to 5.3 lakh doses respectively during this period. Details are furnished in Appendix 2.51 The number of AI centres in the state as on 31-03-2012 was 2986.The number of inseminations done during 2011-12 was 14.85 lakh and calving recorded was 4.1 lakh. This is against 3.7 lakh calving recorded out of 13.9 lakh AI during 2010-11. The average number of inseminations needed for producing one calf is 3.6 (see Appendix 2.53). The quality of AI is not improving and so measures to improve the quality of semen supplied to be taken up immediately. Activities of the Board are given in Appendix 2.54
Special Livestock Breeding Programme (SLBP)
2.80 The calf rearing programme by subsidizing cattle feed for rearing cattle up to 32 months along with health cover and insurance has been under implementation since 1976 onwards. During 2006-07 the scheme was extended to buffalo calves also as a measure to curtail the drastic reduction in the buffalo population. During 2011-12, 12947 calves were enrolled. Year wise details from 2003-04 onwards are furnished in Appendix 2.61
Animal Health Care
2.81 In order to reduce morbidity and mortality, efforts are being made by the State/UT Governments to provide better health care. For it, a network of 27562 polyclinics/hospitals/dispensaries, 25195 veterinary aid centres supported by about 250 disease diagnostic laboratories are functioning in the country. For the production of vaccines, there are 27 veterinary vaccine production units. The primary emphasis is on clinical services and as a result, endemic diseases such as Foot and Mouth Diseases (FMD) are still prevalent in India. With increased trade activity and extensive cross-breeding programmes, the chances of ingress of exotic diseases into the country have increased.
2.82 The State is implementing a programme for Foot and Mouth disease control with the assistance of Government of India. Also Brucellosis has now emerged as a new threat to the livestock wealth of the State. Helminthiasis control also needs attention. Worms and other internal parasites cause considerable economic loss to the farmers. Data regarding outbreaks, attacks and deaths of major contagious diseases of animals in Kerala for the period from 2007-08 to 2011-12 are given in Appendix.2.56.
2.83 Even though vaccinations were carried out, frequent outbreaks were reported which lead to production loss to farmers. Compared to previous years FM outbreaks and attacks are less in 2011-12 and 4 deaths are reported.
2.84 The reports of minor attacks of major diseases like Anthrax, and Hemorrhagic Septicemia are also reported and are more in numbers compared to previous years. The State has already eradicated the dreadful disease of rinderpest and no outbreak was reported after 1994. Outbreak of black quarter also not reported during 2011-12.
Box 2.4 (a)
Production of Vaccine in Veterinary Biological Institute, Palode
The Veterinary Biologicals, Palode is the sole agency engaged in the production and distribution of animal vaccine in the state. The production details of vaccines manufactured here are shown in
Appendix 2.57. Compared to previous year poultry vaccine production during 2011-12 was 189.1 lakh doses as against 236.6 lakh doses during 2010-11 and production of livestock vaccine increased by 40.1 percent from 3.3 lakh doses during 2010-11 to 4.6 lakh doses. Number of vaccinations done during 2011-12 was 16.8 lakh Nos for livestock and 102.2 lakh Nos for poultry. Compared to previous year, vaccination to cattle increased by 2.7 percent and vaccination to poultry increased by 14.8 percent. Anti Rabies Vaccinations done in dogs increased from 1.4 lakh to 1.7 lakh during the year under report. Details are given in Appendix 2.58
Prices
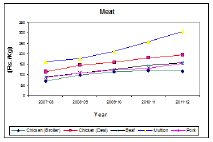
2.85 Average price of important inputs and products of livestock sector for the last five years is presented in Appendix 2.59 and almost all the products recorded increase in prices during the period. Compared to 2010-11 there was increase in the price of all categories of meat except broiler chicken during 2011-12. During 2011-12, the highest increase was in the case of Mutton (18.9%), followed by pork (10.4%). Compared to 2010-11, the price of fowl-white egg increased by 4.2 per cent, brown egg by 8.8 percent and duck egg by 6.2 per cent during 2011-12. Corresponding increase during the previous year was 8.3 percent 14.8 percent and 14 percent respectively.
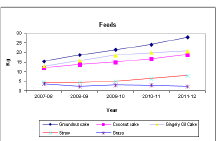
2.86 On the input side, the price of grass recorded 20 percent decrease during 2011-12. Compared to previous year, the price of gingely oil cake increased by 4.4 percent, coconut oil cake by 13.2 percent, straw by 21.2 percent, ground nut cake by 15.7 percent during 2011-12 and the increase in the price of inputs is a serious threat to dairy farming. The trend in average prices of livestock products from 2007-08 to 2011-12 are shown in Fig. 2.9.
Fig. 2.9
Trend in Average Prices of Livestock Products from (2007-08 to 2011-12 )
XIth Five Year Plan
2.87 The budgeted outlay and expenditure for Animal Husbandry and Dairy Sector during XIth Five Year Plan period were र 571.93 crore and र 495.96 crore respectively. During the period, a major shift in plan priority towards food security was approved and separate funds have been provided. Apart from plan support additional support has been provided from RKVY for the development of the sector. Yearwise outlay and expenditure of the sector during XIth Five Year Plan period were as given in Appendix 2.60
Key initiatives in 2012-13
2.88 The key initiatives of the department of Dairy Development and Animal Husbandry Departments in 2012-13 are shown in box.2.4
Box 2.4 (b)
Key Initiatives in 2012-13
• Door step veterinary services introduced.
• Substantial increase in outlay for Special Livestock Breeding Programme (SLBP) has been
provided. It increased from र 9.3 crore to र 25 crore apart from additional support from Rashtri-
ya Krishi Vikas Yojana (RKVY).
• New cattle feed plants initiated in Kozhikode and Idukki.
• New goat and cattle farm in Kasaragod.
• An amount of र10.42 crore has been provided for backyard poultry projects for augmenting egg
production.
• Establishment of hi-tech dairy complexes at Vithura, Kuriyottumala, Kolahalamedu and a hi-tech
layer farm.
• An amount of र15.7 crore has been provided for calf protection programme under XIIIth Finance
Commission Award Scheme.
• Substantial increase in outlays for modernization of dairy co-operatives and milk
SECTION-3
Fisheries Development
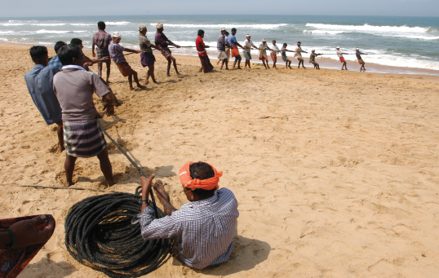
2.89 As per the population census 2011, the fisher folk population in Kerala is 10.02 lakh covering 7.71 lakh in coastal area and 2.31 lakh in inland sector. It is also estimated that about 71600 people are engaged in fishery – allied activities. This fishermen of the state contribute about 8 percent of the GSDP from the agriculture sector which gives the significance of the sector to the state economy. The total fishermen population in Alappuzha district is 1.68 lakh which is the highest fishermen
populated district, followed by Thiruvananthapuram (1.65 lakh) and Ernakulam (1.33 lakh). The district wise details of fisherfolk population are given in Appendix 2.63. The Gross State Domestic Product of the State has increased by about 60 percent during the period from 2005-06 to 2011-12 and the share of fisheries sector in the State Domestic Product has declined from 1.3 to 0.9 percent in the same period. The share of Primary Sector in GSDP has also declined from 17.1 to 9.5 percent. The contribution of fisheries sector in GSDP is given in Appendix 2.64
2.90 Marine fish landings of India during the year 2011 has provisionally been estimated as 3.23 million tones with an increase of about 1.21 lakhs compared to the estimate for the last year. Among the states, Gujarat was the highest contributor of marine fish followed by Kerala. During 2011-12, 5.53 lakh tonnes of marine fish were landed in kerala showing a decline of 0.07 lakh tonnes (1.25%) over the previous year. The high value species among the fish catches are still few, prominent among them are Seer fish, Prawn, Ribbon fish and Mackerel. The quality of these high value species in the total catch ultimately decides the income of the fishermen. The species wise marine fish landings in Kerala from 2008-09 to 2011-12 are shown in Appendix 2.65.
2.91 India has been a major contributor to the world marine fish production and second largest producer of inland fish. The south west comprising Kerala, Karnataka and Goa were the top contributors among regions (31 %) and Tamilnadu among states (21%) followed by Kerala (20%). Presently fisheries and aquaculture contribute 1.2 percent to the national GDP and 5.3 percent to agriculture and allied activities.
Trend in Production
2.92 Estimates of the fishery resources assessment shows that among the maritime states in India, Kerala occupies the 2nd position in marine fish production. The fish production in kerala during 2011-12 was 6.93 lakh tonnes. The marine fishery resources of the state has almost attained the optimum level of production. At national level more than 50 percent of the total fish production is contributed by the inland sector. Government have approved a master plan for increasing the inland fish production of the state from the current level of 75000 tonnes to 2 lakh tonnes over a period of 10 years. The current level of Inland fish production is to the quantum of about 1.40 lakh tones, an increase of 13 percent of the previous year. The species-wise inland fish production in Kerala from 2008-09 to 2011-12 are shown in Appendix 2.66.
2.93 Indian marine fisheries is also passing through a crisis due to its over capacity and open access nature. During 2011-12, India’s total fish production was 6.57 million tonnes of which 3.23 million tonnes was from marine sector and 3.34 million tonnes was from Inland sector (Fig 2.10).
Fig. 2.10
Marine and Inland Fish Production All India (2011-12) Marine and Inland Fish Production Kerala (2011-12)
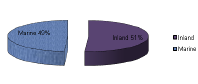

2.94 The marine fish production in Kerala tended to fluctuate while the inland fish production showed a sign of improvement from 1999-2000. During 2011-12, the marine fish production has declined to 5.53 lakh tonnes from 5.60 lakh tonnes of 2010-11. Inland production sustained on increasing trend. During 2011-12, the share of inland fish production to the total fish production of the state was 20 percent. The details of fish production for the last 6 years are given in Appendix 2.67 and Fig 2.11
Fig.2.11
Fish Production in Kerala (2007-08 to 2011-12)
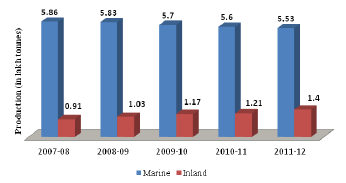
2.95 To improve fish production in Inland water bodies, a comprehensive programme need to be chalked out. It is possible through by utilizing all available resources augmenting the aquaculture production and productivity through diversification and intensive aquaculture practices, ensuring conservation and management of aquatic resources through responsible and participatory approaches. Reservoirs are the most important and promising fresh water resources for fish culture in Kerala. The potential resources of back waters estuaries and river systems are to be suitably utilized for the enhancement of fish production of the State. Strengthening of hatcheries and seed farms are essential at this point. But the production from the Government hatcheries is far below their installed capacity and many of these have not met with their targeted production and maintain quality of their produce. The State Government hatcheries need to be strengthened to have sustainable level of output to meet the projected demands for seeds. The ornamental fish industry is a much promising sector in the inland fisheries. The export potential of the ornamental fisheries may also be suitably utilized for making more income. The programme could be envisaged as an alternative livelihood venture to the fishermen and marginal farmers.
2.96 The Key elements of the XIIth Plan Approach paper in the fisheries sector are launching of a comprehensive coastal area development project covering infrastructure, housing, sanitation, drinking water and livelihood, action plans for augmenting inland fish production to 2 lakh tonnes by the end of the plan from 1.17 lakh tonnes, enhancement of seed production, strengthening of post harvest infrastructure like better fish landing and handling facilities, cold chains, storage facilities as well as marketing facilities for the development of the sector and improvement in the production of value added products, micro enterprises, credit support and coverage under social security. Accordingly the first year plan programme of the XIIth Five Year Plan was launched in 2012-13.
Performance Review under XIth Plan & Annual Plan 2012-13
2.97 The total approved outlay during the XIth Plan under the fisheries sector was र 255.25 crore which accounts 0.6 percent of the total state plan outlay and 11 percent of the outlay under Agriculture & Allied Sectors. But the actual amount budgeted during the plan period was र 380 crore and the expenditure was र437.21 crore (115%). In addition to this an amount of र 55.89 crore was setapart for Integrated Coastal Development Scheme under Special Area Development Programme and the expenditure incurred was र 40 crore (71.64%). The total expenditure under state plan schemes during 2011-12 was र 143.87 crore which accounts 117.4 percent of the state plan outlay. There are 10 partially aided central sector schemes having an outlay of र 42.72 crore and the expenditure during this period was र 47.61 crore. Additional allocation was provided for fishing harbours and share capital contribution to NCDC assisted schemes and thus the expenditure exceeds the outlay provided under Central Sector Schemes. The outlay and expenditure for various schemes implemented in the fisheries sub sector during 2011-12 are given in Appendix 2.69
Debt Relief to Fishermen
2.98 It has been estimated that fisherman have a debt liability of र 524 crore. During the period 2008-09 to 2011-12, an amount of र 36 crore was provided with budget for debt relief measures to fishermen and as on 31.03.2012,र 35.69 crore has been released for this programme.
Major Developmental Programmes
2.99 Government have initiated the new project Matsyakeralam during 2008-09. From 2009-10 to 2011-12, the total amount budgeted for this scheme was र 5.50 crore as state share and the provision was fully utilised for the scheme. The total project cost estimated as र 71.16 crore. The achievement of the project during the first phase shows an encouraging result especially in shrimp and mussel farming. The harvest details are shown in Appendix 2.70 and 2.71 respectively. Under Special Area Development Programme a new project viz., Integrated Coastal Area Development project was started during 2007-08. During the period 2007-10, the project was implemented in Kannur, Kasargode and Thrissur districts covering the projects of water supply, fish landing centres, public centres, dispensaries, biogas plant, anganavadies etc. During 2011-12 had taken up the the coastal area development infrastructure works viz., drinking water supply schemes, hospital buildings, fisheries roads, matsya bhavan etc. at a total outlay of र18.69 crore. During 2012-13, a new scheme viz., model fishing villages was envisaged in the budget with an outlay of र 50 crore under state plan for the development of 25 fishing villages @ र 2 crore per village. More pro active steps in the implementation of the coastal area development project is required since the progress is quite slow.
2.100 During 2011-12 an amount of र100 lakh were expended for the implementation of one paddy one fish in kuttanad and kole lands for covered an area of 1629 ha in kuttanadu and kole lands. About 305 tons of scampi and 1200 tons of fish were produced during 2011-12 and a revenue collection of र 1662.5 lakh was achieved. The details of achievement in oru nellum oru meenum in kuttanad and kole lands from 2006-07 to 2011-12 are given in Appendix 2.72. The project sustainable development of shrimp aquaculture aims at the development of 2500 ha of Pokkali fields of Ernakulam, Thrissur and Alappuzha districts during the Xth Plan period. During 2011-12 an area of 443 ha was brought under culture and an amount of र100 lakh was provided for the scheme. 280 tons of Shrimp worth र 7 crore was produced during the period. The details of shrimp aquaculture production in Pokkali lands from 2005-06 to 2011-12 is given in Appendix 2.73.
Fishing Harbour
2.101 The Government of Kerala has so far implemented 9 fishing harbour and the works of other 8 harbours are in progressing. The completed fishing harbours are Thangassery, Neendakara, Kayamkulam, Munambam, Beypore, Puthiyappa, Chombal, Moplabay and Azheekal. The fishing harbours now supported are Koyilandi, Thalai, Cheruvathoor, Chettuvai and Muthalapozhi. The works of Ponnani, Chethi, Thalai and Koyilandi fishing harbours were completed soon. The construction of Muthalapozhi fishing harbor is lagging. The project was approved in 2000 at a cost of र 13.66 crore with total expenditure till 2011-12 was र 13.52 crore. During 2011-12, र 1341 lakh were allotted for the construction of fishing harbours for which र 743.55 lakh was expended. An amount of र 1533.11 lakh was expended during the year through RIDF. Time bound completion schedules for all ongoing harbours need to be worked out. Status of the progress of ongoing fishing harbours is shown in Appendix 2.74.
2.102 Total revenue collected from the completed fishing harbours and fish landing centres during 2010-11 and 2011-12 were र 410.58 lakh and र 416.04 lakh respectively. Revenue collection from Puthiyappa fishing harbour during 2010-11 and 2011-12 were र 225.85 lakh and र180.99 lakh, which accounts 20 percent decrease over the previous year. During 2011-12 the highest revenue collection was from Puthiyappa harbour which accounts 43.50 percent of the total revenue collection. Neendakara fishing harbour contributed 28 percent of the total revenue collection during 2011-12 which accounts 7 percent increase in the revenue collection for the previous year. The details are given in Appendix 2.75.
2.103 Under RIDF XI, NABARD has approved two projects viz balance work of Kayamkulam fishing harbour and modernisation of Neendakara fishing harbour and sanctioned a loan amount of र1062.54 lakh and र 895 lakh respectively. Under RIDF XIII, NABARD has sanctioned a loan of र 1026.43 lakh for the construction of fishing harbour at Thalai. The expenditure upto March 2012 is र 717.06 lakh. Details of NABARD assisted scheme through Harbour Engineering Department is given in Appendix 2.76. Prioritised action plan has to be prepared for the completion of all ongoing and pending infrastructure projects. Expansion of more harbours to be based on need and technical studies.
Social Security and Livelihood Support to Fishermen Community
2.104 The major highlights of social security schemes are given in Appendix 2.77 to 2.78. During 2011-12, 578 number of houses were completed including spillover from 2010-11and the expenditure incurred was र 276 lakh. The saving cum relief schemes provided assistance to about 185348 beneficiaries at an amount of र 2120 lakh.
Matsyafed
2.105 Matsyafed is an apex federation of 666 primary level Fishermen Development Welfare Co-operative Societies, of which 341 numbers are in marine sector, 192 are in inland sector and 133 women co-operative societies. The total membership in these societies is more than 3 lakhs. The paid up share capital of the federation is र150 crore. Matsyafed have organised more than 14715 SHGs with 179532 members. The groups have mobilized र 5248 lakh as thrift. The achievement of various programmes implemented by Matsyafed is given in Appendix 2.80.
2.106 In the last Five Year Plan, marine fisheries sector has achieved better growth in its infrastructure development. The XIIth Plan strategy is to ensure sustainable growth of Fish and Fisheries for nutrition, food security and economic growth by ensuring proper utilization of infrastructure created in the last plan. Special emphasis has to be given to conservation and management of inshore fishery resources, enhancement of offshore marine fish production and maximum utilization of harvested fish and its value addition. The major issues in the sector are price exploitation of selected stock, ineffective regulation, ever increasing fleet size, lack of responsible fishing practices etc. The marine environment has to be revitalized with the introduction of artificial reef to enhance its productivity. Maximum utilization of harvested resources can be ensured for its proper storage, transportation and distribution. Effective preservation of fish quality as per international standard, promote export as well as domestic marketing legislation is needed for the assurance of hygiene and quality in domestic fish marketing. The hygiene condition of the harbours need to be modernized by integrated harbor management societies may be constituted for each harbor. Regarding social infrastructure, provision for safe shelter and drinking water, improvement of public health and education facilities, total sanitation and solid waste management etc. needs special care and attention. Focussed attention for the implementation of coastal area development project including livelihood security is urgently required.
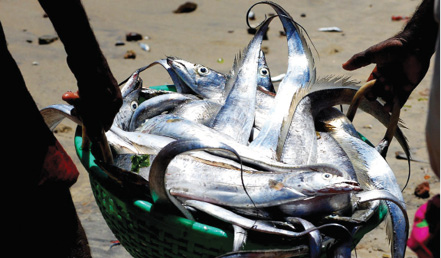
Cage Culture
2.107 The enclosure fish culture can play a significant role in augmenting yield from capture fishery. The advantage of this captive aquaculture is high production owing to dense stocking and intensive feeding. Cage fish culture has great potential in large water bodies such as lakes and reservoirs. The endemic fish E.suratensis has been demonstrated to grow upto 230- 350 gm in seven to eight months when reared under a feeding regime using commercial pellets. A study was conducted by Department of Aquatic Biology and Fisheries, University of Kerala to find out the effects and consequences of small scale cage culture technology adoption in Kerala. The salient findings of the study is given in the Box. 2.5
Box 2.5
Effects and Consequences of Small Scale Cage Culture Technology Adoption in Kerala
• There is a low level of adoption of cage culture technology in the state and there is a lack of trust
in the technology and its ability to provide economic returns.
• Rains and extreme summer leading to receding water levels were identified as constraints.
• The algal booms in the cages causing fish mortality has been reported by the respondents.
• The state fish Etroplus suratensis (Karimeen) was reared in cages and one fourth of the
respondents faced problems in seed collection and maintaining stocking densities at
recommended levels in cages.
• The risk factors in cage culture was found to be low and no diseases were recorded during the
cage culture.
• Attack by crabs, rodents, snakes and birds were risk factors identified.
• Majority of the respondents reported low growth performance of species in cages.
• Poor quality of net and availability of seed were also some of the issues identified in the study.
• The study emphasised the need to improve the motivation level of farmers through
demonstrations for further popularising the cage culture practice.
Source :Proceedings of the National Seminar on Faunal Diversity of Kerala, 23-24 March 2012
SECTION -4
Water Resources
2.108 Irrigation development in Kerala is mainly centered on the development of major and medium irrigation projects. In each Plan, priority in allocation was given for the development of major and medium irrigation projects. About 50 to 60 percent of the investment in each plan was made for this purpose. Rice is the major crop benefited through irrigation infrastructure. Even in the case of this crop, the incremental yield, which the irrigation support could bring, is not significant. With the fast changes taking place in the farm front of Kerala with notable reduction in the area under rice cultivation, even the distribution systems already developed for gravity irrigation to service rice cultivation now require realignment. Investments in irrigation are changing globally in response to changes in environment and experience with previous projects. Increased water scarcity has shifted the focus from exploitation of water resources and building infrastructure to improvement of water use efficiency.
Live Storage Capacities of Irrigation Reservoirs
2.109 The surface irrigation constitute major chunk of irrigation infrastructure in the state. There are 18 dams in the state intended for irrigation. Out of this, 14 have storages and remaining are barrages. The live storage position of the reservoirs during the beginning and end of the monsoon period during 2010 to 2012 are given in Appendix 2.81 In the beginning of the Monsoon in 2012 the total storage was 404 Mm3 and at the end of the monsoon, the level was 744 Mm3, against the levels of 525 Mm3 and 1274 Mm3 respectively, during the previous year. The decline in storage is due to the deficit rainfall reported in the state.
Fig 2.12
Live Storage Position in the Reservoirs (2010, 2011 & 2012)
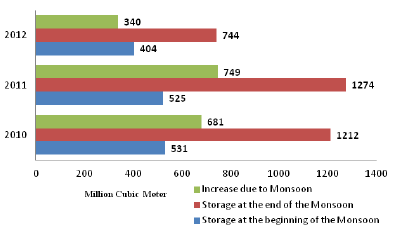
Fig 2.13
Live Storage Position in the Reservoirs (Average for 10 years): 2010, 2011 & 2012
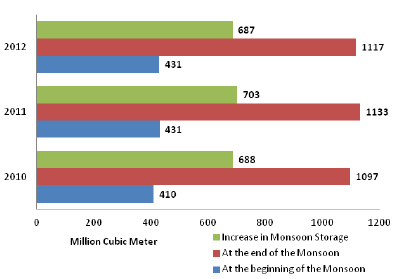
Water Resource Management
2.110 Development patterns, increasing population pressure and the demand for the better livelihood across the globe are contributing to a looming global water crisis. Efforts to improve the efficiency of water use and limit demand in the agriculture sector, the largest consumer of water, have had limited success. Integrated water resources management on basin wise has made limited progress. The basic premise of water resource management is that river basins are best managed and developed as an integrated whole. In many cases the need for river infrastructure such as weirs, dykes, regulators and other storage structures are primary drivers for adopting institutional solutions. During XII th Plan, it could be attempted in the state to select 2-3 basins for integrated water resources management. Bharathapuzha basin is one such basin which needs immediate attention.
Review of Major Projects
2.111 The overall performance of the major and medium irrigation sector during the initial years was not encouraging. The cumulative area brought under irrigation through major and medium irrigation projects is 32044 hectares (gross). The details of the progress of implementation of ongoing projects as on December 2012 are given in Appendix 2.82
Karapuzha Irrigation Project
2.112 Karapuzha Project is the first project for irrigation taken up in the Wayanad District of Kerala to create a reservior of 76.50 Mm3 storage capacities. The original estimate of the project was र 7.60 crore in 1979and the revised estimate as per 2010 schedule of rates was र 441.50 crore. The cumulative expenditure incurred up to Dec 2012 is र 289.62 crore. The project has been partially commissioned on 20.6.2010 and an ayacut area of 601 ha has been achieved so far. Major components under head works and the works of 8.805 Km right and 16.59 Km left bank canals are also completed. Land acquisition in respect of distributaries of Left and Right Bank Canals are yet to be completed. The progress of implementation of the project is very slow. More proactive steps are required to complete the project in the drought affected district. The project has been included under AIBP but the implementation of the work plan is very slow. Prioritization of work to complete the ongoing work is also required.
Muvattupuzha Valley Irrigation Project
2.113 The project envisages the utilisation of the tailrace water from the Idukki Hydro electric project and the works started during 1978. Water from the reservoir is intended to give irrigation facilities to 19237 ha.(net) and 37737 ha.(gross) in Ernakulam, Kottayam and Idukki districts. The estimated cost of the project as per 1980 Schedule of Rates was र 48.08 crore and the revised estimate cost, which is under finalization, based on 2012 SoR, reported is र 1075 crore. The expenditure as on Dec 2012 is र 826.16 crores. Out of which the work of the dam, Left and Right bank main Canals are completed and in respect of branches and distributaries, a total length of 50.971 km, 180.557 km respectively, have been completed so far. The project was commissioned partly in November 2004, and the ayacut area created so far is 31106 ha gross. The project has to be closed at a convenient stage for the optimum utlisation of resources invested considering the implementation of the project for more than three decades. The cropping pattern in the ayacut has changed and additional investment is required to irrigate the crops.
Idamalayar Irrigation Project
2.114 The Idamalayar Irrigation Project is a diversion scheme intended to irrigate an extend of 14394 ha. of wet and dry lands and the Cultivable Command Area (C.C.A.) is 13209 Ha. The latest estimate of the project being prepared as per 2011 SOR is र 694 crores and the cumulative expenditure as on December 2012 is र 367.98 crores.
2.115 The works of 85 percent of main canal, 45 percent of low level canal, 37 percent of link canal and 95 percent of RBMC have been completed so far. In view of the Government policy to complete the long pending projects, the execution of the works needs to be arranged to the project at an early phase of the plan period so as to close the project in the XIIth Five Year Plan itself.
Banasurasagar Irrigation Project
2.116 The project was commenced in 1971 with an estimated cost of र 11.37 crore to irrigate an area of 2800 ha. agriculture land for the second and third crops. The project report was revised based on 1996 SoR and Administrative Sanction was given to a cost of र 37.88 crores. The revised estimate of the project based on 2010 SoR is र185.5 crores. The work of the Main canal of length 2.73 Km is completed and the works of aqueduct from Ch.0-150 M. and from Ch. 1130 M to 1500 M are in the progress. The land acquisition process of distributaries is in the progress. Expenditure incurred up to December 2012 is र 42.31 crore including a part of the share cost given to KSEB.
Accelerated Irrigation Benefit Programme (AIBP)
2.117 The release of central assistance to Kerala under AIBP is very low compared to other states. There has been a decreasing trend in the utilization during the last few years and very low release during the year under report. The details of release of central assistance under AIBP to Kerala with respect to other states are shown in the Appendix 2.83. During the period from 1998-99 to 2011-12 (Upto December 2011), Government of India had sanctioned र 49376.72 crore to various states out of which, the assistance sanctioned to Kerala was र 160.52 crore (0.3%). During the XIth Plan period, from 2007-08 to 2011-12 (upto December 2011) the corre ponding figures were र 29089.08 crore and र 14.73 crore (0.05 %) respectively. The details of release of assistance under AIBP from 1998-99 to 2011-12 is shown in the Appendix 2.84 and that of implementation in the state during XIth Plan period are shown in Appendix 2.85.More focused attention is required for the implementation of AIBP assistance in Kerala. The assistance has been released for Muvattupuzha project, Karappuzha and three projects under Prime Minister’s rehabilitation package in Palakkad District covering Malampuzha, Kanjirapuzha and Chitturpuzha projects.
Irrigation Status
2.118 The source-wise area irrigated as on March 2012 is given in Appendix 2.86 As per the assessment of the Directorate of Economics and Statistics the net irrigated area in the state as on March 2012, is 4.09 lakh ha. and the gross area irrigated is 4.91 lakh ha. There is an increase of 5 percent in the gross irrigated area of the state in compared to the previous year of 2010-11. During 2011-12, among the crops, coconut tops among the major crop supported by irrigation. It accounted for about 37 per cent followed by paddy 31 percent, banana 9 percent, arecanut 8 percent and vegetable 4 percent. There has been a good progress in irrigated area under Vegetable cultivation as well as coconut during the year and also an increase in the area under irrigation for paddy cultivation compared to the previous year.
Minor Irrigation
2.119 Minor irrigation is considered to have an important role to play in states like Kerala, where the average farm size is small. A comprehensive revival of minor irrigation schemes were implemented under Malabar package during XIth Five Year Plan. A master plan needs to be prepared for development of minor irrigation in the state. A survey has already been completed on tanks and ponds. The cumulative physical achievement of Minor irrigation up to XIth Five Year Plan was 2.82 lakh ha. (net). Minor irrigation has been given a considerable thrust during XIth Plan and the same accounted nearly 19 percent of the total budgeted outlay. The details of physical achievement for 2009-10, 2010-11 and 2011-12 are shown in Appendix 2.87 NABARD has been providing loan assistance for irrigation works through RIDF phase I to XVII since 1995-96. The assistance of NABARD is by way of reimbursement. RIDF I to XI have been closed and the works under RIDF XIII to XVII are in progress. Under RIDF XIII the work of RCB at Chamravattom sanctioned by NABARD under project I been completed. One work under RIDF XV and 15 works under RIDF XVI and 24 works in RIDF XVII are in progress and all the works under RIDF XIV has been completed.
Ground Water Development
2.120 Ground water fulfils the irrigation needs of around 50 percent of irrigated area. The total ground water recharge in the State is estimated as 6840.80 MCM. The existing ground water draft for all uses, based on the GEC 2004 methodology is 2693.38 MCM including 1596.02 MCM for irrigation. Net ground water availability for future irrigation use is worked out as 3221.23 MCM. The overall stage of development of the State is 43.2 percent. The district wise stage of development is maximum in Kasaragod (71.2%) and minimum in Wayanad district (21.6%). The blocks were categorised based on the stage of development and long term trend of ground water levels during pre- and post-monsoon seasons. Thus, out of 151 blocks, 33 are showing a stage of development 70 percent or more. Three blocks are falling under ‘over- exploited’, six blocks under ‘critical’ and six blocks under semi-critical’ category. The remaining 136 blocks are categorized as ‘safe’ blocks. The expenditure incurred during the period 2011-12 was र 7.91 crores against the budget outlay of र 10.58 crores. The detailed physical achievement during the year under report is given in Appendix 2.88.
Performance during the XIth Plan period
2.121 During the XIth Plan period an expenditure of र 619.24 crore was incurred for Major and Medium irrigation, र 188.14 crore for Minor Irrigation र 13.10 crore for CADA and र 333.56 crores for Flood Management and Coastal zone management against the total budgeted outlay of र 1651.18 crore. A major share of the total outlay for the water resource sector (51 %) was budgeted for Major and Medium sector, followed by Flood Management and Coastal zone Management (25 %) and Minor Irrigation (22%). The target set for the realization of additional irrigation potential during XIth Plan was 2.50 ha (gross) comprising 50 lakh ha under major and 2.00 lakh under minor irrigation and the actual achievement aggregates to 1.09 lakh ha. Overall performance of the Irrigation sector was not encouraging during the XIth Plan, besides poor utilization AIBP assistance and under performance in the implementation of Kuttanad Package also aggravated the situation.
SECTION -5
Forestry and Wild Life
2.122 The forest cover of the Kerala State as per the 2011 report of FSI was 17300 sq.km. with 1442 sq.km of very dense forest, 9394 sq.km of moderate dense forest and 6464 sq.km of open forest. This constitute 44.5 percent of the total geographical area of the State, shows that the forest cover of Kerala increased over previous assessment. There is an increase of very dense forest cover to the tune of 419 sq.km, moderate forest of 774 sq.km and open forest 536 sq.km. As per FSI, the main reason for forest cover increase was due to the change in the area of the trees outside forests. In Kerala, Idukki District has the maximum forest cover of 3930 sq.km and Alappuha District has the lowest forest cover of 38 sq.km. In terms of percentage of forest cover with total geographical area, Wayanad has the highest forest cover of 83.3 percent, followed by Idukki and Pathanamthitta. The district wise details of forest cover in Kerala is given in Appendix 2.99. The estimated forest area (provisional) in Kerala is 11309.5 sq.km. This includes 9107.2 sq.km of reserve forest, 364.5 sq.km of proposed reserves and 1837.8 sq.km of vested forests. Division wise details of forest area are given in Appendix 2.100.
2.123 The total forest cover of the country as per India State of Forest Report 2011 is 78.3 million ha. which constitute 23.8 percent of the geographical area of the country. In comparison to the 2009 assessment, there is a decrease of 367 sq.km. in country’s forest cover. 15 states have registered aggregate increase of 5000 sq.km. in their forest cover with Punjab leading with increase of 100 sq.km. 12 States mainly in (Northern Eastern States) have shown decreased the extent of 867 sq.km. Decline of 281 sq.km. in forest cover of Andra Pradesh is mainly attributed to cutting the Eucalyptus and other species. The state of Madhyapradesh has the largest forest cover in the country at 77700 sq.km. followed by Arunachal Pradesh at 67410 sq.km. As per the 2011 assessment, forest cover of Kerala is 17300 sq.km.
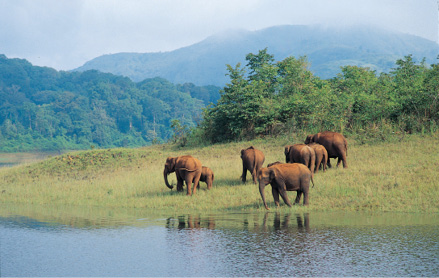
Natural Forest
2.124 The forest of Kerala is mainly classified into 5 major categories. The coverage of the plantations forestry is to the extent of 13.2 percent of the total area. The major types of forests in Kerala are given in Appendix. 2.101. The quantity of timber production in 2011-12 was 17283.2 cum (round log). The number of bamboos and reeds produced were 4.7 lakh and 93.9 lakh respectively. The sandal wood production was 52104.1 kg. The trend in production of forest produces from 2001-02 to 2011-12 (provisional) are shown in Appendix 2.102.
2.125 The forest policy of the state is guided by the 1988 National Forest Policy. In Kerala the strategies adopted for the development of forests envisages maintenance of environmental stability through preservation and reduction of degraded forests, conservation of bio-diversity, increasing productivity of forest, increasing substantially the forest cover through massive afforestation and developing participatory forest management. A comprehensive state forest policy to address the specific problems and issues related to the conservation of forests and biodiversity of the state as well as the livelihood needs of the forest development communities has been formulated during 2007. The Forest Management Policy of the state encompasses technology improvement, bio-diversity conservation and development of partnership with the forest dependent communities and fringe dwellers. Special thrust is also given for protecting species of plants and animals.
National Afforestation Programme
2.126 In the implementation of NAP, 27 Forest Development Agencies were participated. An extend of 2585.99 ha. of degraded forest has been afforested under the scheme during 2011-12.
Forest Revenue
2.127 The forests contribute substantially to the non-tax revenue of the State. The revenue from the forestry sector by way of sale of timber and other forest products comes to र 220.7 crore in 2011-12 and the revenue from the forest sector in 2010-11 was र 274.4 crore, compared to the forest revenue for these two years, a decrease of 20 percent over the previous year. Major portion of the forest revenue is from timber (Fig. 2.14). During 2011-12, र182.5 crore was the revenue from timber, which account for 82.7 percent of the total forest revenue. The forest also supply non-wood forest produce valued at र 5 crore annually. Forestry sector provides maximum employment opportunities to the rural masses including the tribes. Details are given in Appendix 2.104
Fig 2.14
Forest Revenue in Kerala (2007-08 to 2011-12)
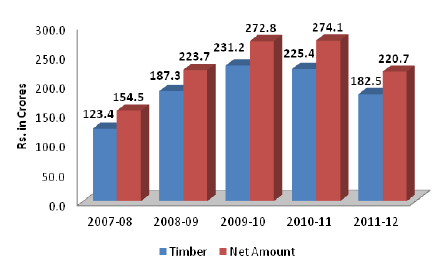
Wild Life and Biosphere Reserve
2.128 The ‘Malabar Wildlife Sanctuary’ was constituted in 2009 with an extend of 7421.5 Ha (74.2 Sq.Km) area. Also a new wild life sanctuary by name “Kottiyoor Wild life Sanctuary” was constituted in 2011 with an extent of 30.4 sq.km. The name of sanctuaries, National Park, Biosphere Reserves and other Protected Areas in Kerala is shown in the Appendix 2.105. The India Eco-development Project implemented in Periyar Tiger Reserve has got wide recognition nationally. The project was successful in weaning out forest offenders and make them part of conservation efforts. Presently, the Forest Department is trying to emulate the Periyar model in the management of all the PAs of the State. During 2011-12, an amount of र 2012 lakh was earmarked under various plan schemes for protected area management and out of which र 1628 lakh were utilized.
General Forestry
2.129 Natural Forests in Kerala are being managed mainly for sustaining the life support systems and biodiversity conservation. During 2011-12 also, no timber was extracted from the natural forests by way of clear felling or selection felling. Only timber from wind fallen trees was extracted wherever it is economically viable. Under ‘Hardwood’ species 159 ha new areas was raised and 585 ha was maintained during the year 2011-12. Also under industrial plantation, 534.1 ha were newly planted and 1931.3 ha were maintained. Under the NTFP including medicinal plantation, 311.9 ha new areas was raised and 1690.2 ha were maintained.
Performance review under XIth Plan and Annual Plan 2012-13
2.130 The total state plan outlay during XIth Plan under forestry sector was र288.87 crore and the expenditure was र 251.1 crore (87.2%). In addition an amount of र114.6 crore was provided for centrally sponsored schemes and the expenditure reported was र67.6 crore (59%) The state plan expenditure during 2011-12 is र 70.4 crore against the budgeted outlay of र75.4 crore, which includes forest protection with an expenditure of र13.1 crore, regeneration of denuded forest with र1.8 crore, strengthening bio-diversity conservation and management of protected area with र12.88 crore, strengthening of infrastructure facilities with र4.5 crore for roads and buildings, improving productivity of Plantation with र 5.6 crore, extension forestry with र 7.9 crore and XIIIth Finance Commission Award with र13.8 crore. Under central sector scheme the expenditure reported was 45 percent of the budgeted outlay. The outlay and expenditure for various schemes implemented in the Forestry sector is shown in Appendix 2.106. The major physical achievements during the XIth Plan period is shown in Appendix 2.107. The major physical achievements during 2011-12 were distribution of seedlings/plants under Harithakeralam, Harithatheeram and Vazhiyora Thanal programme is 70.22 lakh nos., construction of cairns 2214 lakh nos., construction of kayyala 3.927 km., construction of fire line 7204 km., regeneration denuded forest 364 ha., planting of hardwood species 159 ha., planting of NTFP including medicinal plants 311 ha., improvement of forest roads 75 km. and launching the project Suvarnodhyanam at Nedumbasseri in 4 ha. area.
Key initiatives during 2012-13
2.131 Key initiatives of the department during 2012-13 are establishment of Zoological Park in Puthur, Thrissur District; renovation of forest museum at PTP Nagar, Thiruvananthapuram as National History museum, establishing orchidarium at Vagamon in Idukki District, setting up elephant care centre at Kottur, Kappukode in Thiruvananthapuram District, establishing Gandhi Smrithivanam and eco-tourism project at Purakkad in Alappuzha District, establishment of new forest stations and model forest stations, establishment of Kottiyoor Wildlife Sanctuary etc.
Management of Non -Wood Forest Produce (NWFP)
2.132 The quantities of bamboo and reed annually harvested are at a level of 40-50 thousand tonnes of bamboo and 80-100 thousand tonnes of reeds. The productivity and management of NWFPs are to be improved through sustainable and scientific management by adopting improved methods of harvesting, processing, value addition and marketing. Under the scheme Management of NWFPs, new NWFP species were planted at an area of 311.90 ha. Also maintenance of NWFP plantations of different species was done at an area of 1690.20 ha. A new brand for value added products of NWFP known as “Vanasree” was developed and 22 sales outlets of vanasree products were established in the State.
Afforestation Outside Forest Area
2.133 The objective of the programme is to increase tree cover in non-forest areas to achieve the ideal target of 33.3 percent of forest cover. The department have embarked on massive afforestation programme outside forest areas since 2007 with novel ideas. The massive afforestation programme launched outside the forest areas are ‘Entemaram programme, ‘Nammude maram programme, Vazhiyora thanal programme, Haritha theeram programme and Haritha keralam programme’. The total number of seedlings distributed/planted under the various programmes upto 31-03.2012 are 258.34 lakh. The details of seedlings distributed under these programmes are given in Appendix 2.108. The sustainability of the trees planted has to be ensured.
SECTION -6
Environment
2.134 The fragile nature of ecosystem in Kerala is a concern and many natural and man-made causes pose a great threat to its biodiversity. About 159 species of flowering plants are threatened and same is the case with hundreds of animal species. The major man made causes include collection of firewood, illicit felling of trees, cattle grazing, encroachments, poaching, illegal sand mining, mass tourism soil, water and land contamination. Investigations of hazardous waste contaminated cites conducted by CPCB reported that the Kuzhikandom thodu and Ammenthuruthu in the Eloor-Edayar industrial area of Kochi are contaminated with heavy metals and persistent organic pollutants. The ground water and surface water monitoring revealed the presence of high concentration of pesticides in the Eloor area of Kochi (The summary of state wise/Union Teritory wise status of highly polluting industries in 17 categories indicated that in Kerala of the total of 49 industries, 24 are complying with standards, 8 are not complying and 17 have been closed down. Among the 29 grossly polluting industries in the state discharging their effluents in rivers and lakes (as on 31st March 2011), 20 are complying, 2 are not complying and 7 have been closed down ( Source :CPCB Annual Report, 2010-11).
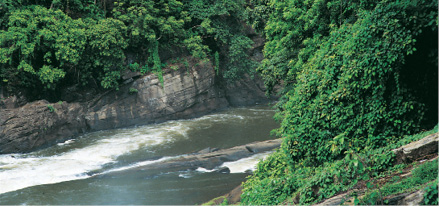
The Environmental Performance Index (EPI)
2.135 The Environmental Performance Index(EPI) is taken as a yard stick to measure the efficiency in keeping the environment properly by the Planning Commission, Government of India. The 2012 EPI offers a composite index of current national environmental protection efforts. Recognizing that on-the-ground conditions are the ultimate gauge of environmental performance, the EPI focuses on measurable outcomes that can be linked to policy targets and tracked over time. The EPI builds on measures relevant to two core objectives – (i) reducing environmental stress to human health (the environmental health objective) and (ii) protecting ecosystems and natural resources (the ecosystem vitality objective). After studying different methodologies an EPI methodology named as Planning Commission environmental performance index (PC–EPI) has been evolved for adoption, which calculates EPI scores for the selected criteria for all the states and Union Territories (UTs). The methodology evolved for ranking and status of Kerala with respect to PC-EPI are discussed in the Box 2.6
Box 2.6
Environmental Performance Index of Indian States 2012– Ranking of Kerala
Methodology
The Environmental Performance Index( EPI) christened Planning Commission-EPI is based on 5 categories such as air pollution, forests, water quality, waste management and climate change comprising 16 indicators. Indicators were sought to cover the full spectrum of issues
underlying each of the major components of the environment, i.e. criteria identified. To ensure the use of the best-suited metrics, the indicator selection criteria applied were relevance (the indicator clearly tracks the environmental issue of concern), performance orientation (the indicator tracks
ambient conditions or on-the-ground results to national standards and requirements) and data quality (the data used represent the measures taken by the states). The cumulative EPI is a measure of environmental well being of the state ie. the states with score 1 are characterised by cleaner environment, adherence to environmental standards including implementation of
legislation and institutional mechanism and efforts towards National Resource Conservation. Eachcriteria is assigned a maximum score of “one” and based on average score states are ranked.
PC-EPI ranking of Kerala
In air pollution category the state has been ranked 1, in water quality the rank assigned was 24, in forest the rank was 20, in waste management and climate change the rank assigned to the state was 16. The Final Environmental Performance Index of Kerala in 2012 was 9 and the score was 0.6660. During 2011, the Final Environmental Performance Index of the state was at 15 and the score was only 0.6311 which indicates the improvement in the environmental management.
(Source: Indrani Chandrasekharan, R.Senthil Kumar, Seena Reghunathan and Shweta
Chandrasekaran, Construction of Environmental Performance Index and ranking of states,
Current Science, Vo. 104, No. 3
River Water Quality
2.136 The monitoring programme on river Water Quality of Kerala was undertaken by KSCSTE. In the recently published 4th part of the report covers water quality status of Chaliyar, Kallai, Achencoil and Kuttiyadi River basins. Water quality problems of Kuttiyadi river basin are associated with pH, colour, TDS, chloride, hardness, sodium, potassium and bacteriological contamination . In pre-monsoon season 100 percent of the surface water samples were contaminated with E.coli, in post-monsoon season 95 percent of surface water samples were contaminated and in monsoon season 32 percent surface water samples were contaminated with E.coli. Lindane, Aldrin and DDD were detected surface water samples collected from Kuttiyadi River. The analysis of groundwater samples indicates that 80 percent of samples had pH below the desirable limit. In Chaliyar river basin almost all surface water samples were found to be alkaline in nature. EC and TDS were much high in the downstream stations of the Chaliyar river basin during post monsoon and pre monsoon seasons. Due to salinity intrusion, sodium and potassium values were found to be high in pre-monsoon season in the downstream region. The value of Biochemical Oxygen Demand varied from 0.2 to 7.2 mg/l. In post-monsoon 68 percent of the ground water samples were bacteriologically contaminated where as in premonsoon and monsoon it was 41 percent and 20 percent respectively. In Kallai basin almost all surface water samples were found to be alkaline in nature. The value of chloride was found to be high in pre monsoon season, the value is 10200mg/l in the downstream region. The maximum value of BOD (13.3 mg/l) was observed at Muriyad Bridge. Of the total samples collected, 64 percent of the surface water samples were contaminated. Maximum pH (9.9) value was observed for the ground water sample collected from Kozhikode Corporation area during post monsoon season. In case of Achencoil river basin, during post-monsoon 35 percent samples and in monsoon, 20 percent of the total samples showed pH less than 6.5. Almost all the water samples were found to be bacteriologically contaminated and showed higher index for total coliform. 95 percent of the water samples were tested positive for E.coli in pre-monsoon. But in post and monsoon seasons, the percentage of E.coli contamination was 65 percent and 30 percent respectively. Majority of the groundwater samples were found to be acidic in nature (Source : Environmental monitoring programme on water quality -2012, KSCSTE).
2.137 Environmental concerns have assumed significance in the recent years. Commensurate with industrial expansion, a strong regulatory mechanism is required to ensure minimum environmental standards. Concerted efforts are needed to educate the people on the importance of environmental protection and for redressing the complaints of the public on pollution problems and environmental issues. Environmental protection is to be incorporated as a part of curriculum in school and college education. The activities of the students related to environmental protection should be recognised within the academic system and should be encouraged by providing grace marks or certificate of recognition. The Green Awards constituted by the Kerala State Biodiversity Board for recognising outstanding contributions of individual/organisations in the field of nature/biodiversity conservation is an initiation in this direction. Peoples Bio Diversity Register is a comprehensive data base recording people’s traditional knowledge and insight of the status, uses, history, ongoing changes and forces driving these changes on the biological diversity resources of their own localities. The Kerala State Biodiversity Board has completed the preparation of 412 Biodiversity Registers out of total 978 panchayats in the state by 2011-12. The Board has also achieved the constitution of Biodiversity Management Committees in all the panchayats in the state.
SECTION -7
Co- operation & Agricultural Finance
Support by National Co operative Development Corporation (NCDC)
2.138 As on 31.3.2012, the cumulative financial assistance of the NCDC was र 4415.9 crores in Kerala. During 2011-12 Kerala stood 1st in all for sanctions and 3rd for disbursement of NCDC assistance to the States. Sanctions and releases of funds to Kerala for 2011-12 was र1428.6 crore and र 895.1 crore respectively, contributing around 20 percent of total sanctions and 18 percent of total release made by NCDC, country wide. Under NCDC’s direct funding scheme, during 2011-12, an amount of र 1315 crore was sanctioned and र 810 crore released to the Kerala State Cooperative Agriculture & Rural Development Bank Ltd and 10 District Cooperative Banks as short term working capital for meeting their credit requirements in Agriculture & Allied sectors.
2.139 Activity wise sanction and release of assistance from NCDC are shown in Appendix 2.109.The Year-Wise amount released by NCDC from 1962-63 to 2011-12 with rate of interest is given in Appendix 2.110. The interest rate of NCDC loans ranged from 7.5 percent to 11.8 percent in 2010-11 which in view to 10.8 percent to 13 percent on 2011-12. The interest rate of NCDC loan is referred as one of the highest rates reported. Deduction in rate seems to be essentially to avail more support from NCDC
Primary Agricultural Credit Societies (PACS)
2.140 The Co-operative Credit structure in Kerala comprise of 1616 Primary Agricultural Credit Societies (PACS) and 63 affiliated Primary Co-operative Agricultural and Rural Development Banks supported by the Central and Apex Co-operative banks. As on 31.3.2012, there were 1616 PACS out of which 724 were running in loss and 56 societies were threatening under liquidation. The PACS are functioning with a paid up share capital of र1809.8 crores and reserves of र 2150.8 crores. The co-operatives during the year under report was encouraging. The total loan disbursed during 2011-12 was र 46689.6 crores against that of र 36822.3 crores in 2010-11. Compared to the previous year, there was an increase in the disbursement of short term and medium term loans. In the case of loan disbursement 31 percent increase is recorded in the agriculture sector.
2.141 The Selected indicators of the credit operations of the Primary Agricultural Credit Societies show that, during 2011-12, deposits of the societies increased to र 39856.9 crores as against र 32527.6 crores during 2010-11. The average deposit per member is increased to र 8514.6 from last year’s level of र 6340.7. Similarly the average working capital position of the societies increased to र 4732.2 lakh against र 2484.2 lakh during 2010-11. Selected indicators and credit operations of PACS are given in Appendix 2.111 and Appendix 2.112.
Deposit Mobilisation Campaign by Co operative Societies
2.142 Deposit Mobilisation campaigns by co-operative credit institutions continued during the year under report also. The deposit mobilisation by the Co operatives have shown an increasing trend over the years. During the period under review, the Co operatives could mobilize र 2592.8 crore as against the target of र 1905.7 crores, showing 136.1 percent of increase, which was 126.3 percent in the previous year. Year wise target and achievement is given in Appendix 2.113.
XIth Plan Performance
2.143 The XIth Plan outlay envisaged for the sector was र 113 crores. The budget outlay for the XIth Plan was 135.60 crores and the expenditure was र 144.03 crores ie, 106.21 percent of the budgeted outlay. The sub-sector wise financial achievement during the XIth Plan is given in Appendix 2.114. The proactive involvement of co-operatives could be considered in procurement of farm produce and establishment of more agro-processing units in the state. A major project for setting up of rural godown with the support of RIDF could be considered.
2.144 The co-operative movement in Kerala has a solid foundation and impressive record in terms of strength and financial stability. There are 13766 co operative societies were working under the Registrar of Co-operative Societies. 2689 miscellaneous registered professional, cultural co operatives generating employment, income to the weaker section of the community were functioning in the state. Details are given Appendix 2.115.The major physical achievements in the sector during 2012 is shown in Appendix 2.116. The Integrated Co-operative Development Project (ICDP) was successfully implemented in all districts and the second phase of ICDP in Wayanad district is under implementation.
Agricultural Finance
2.145 Agency-wise disbursement of the annual credit flow in the state reveals that out of total disbursal of priority sector advances, commercial banks stood at the first place disbursing र 40159 crore (57.6%) in 2011-12, followed by Co-operative Banks (35.4%), RRBs (6.4%) and KFC(0.6%). In Agriculture lending also commercial banks dominated by disbursing र 23889 crore (68.1%) followed by Co operative Banks (23.9%) and RRBs (8%). Details are given in Appendix.2.119.
2.146 The credit flow to agriculture sector during the last 5 years is given in Table 2.4 The share of production credit has increased by 6 percent while investment credit diminished by 6 percent during 2011-12.
Table 2.4
Production and Investment Credit to Agriculture Sector
(र Crores)
Year |
Production Credit | Investment Credit | Total |
| 2007-08 | 13203 (83%) | 2757 (17%) | 15960 (100%) |
| 2008-09 | 14605 (78%) | 4228 (22%) | 18836 (100%) |
| 2009-10 | 18817 (78%) | 5307 (22%) | 24124 (100%) |
| 2010-11 | 23512 (82%) | 5141 (18%) | 28653 (100%) |
| 2011-12 | 27728 (88%) | 3901 (12%) | 31629 (100%) |
Source: SLBC
2.147 In the agency-wise analysis, it is seen that the major portion of short term and medium term credit requirements in the state are met by commercial banks followed by the Co-operative banking sector consisting of the State Co operative Banks, District Co-operative banks and Primary Agriculture Credit Societies which covers 1/5th of the activities. The share of co operatives in the disbursal was 100 per cent in production credit. The share of RRBs in production credit and investment credit was 99 per cent and 1 per cent respectively. Details of credit flow during 2011-12 is given in Appendix 2.120.
Long term credit:
2.148 A net work consisting of the Kerala State Co-operative Agricultural and Rural Development Bank (KSCARDB) at the Apex and 63 Primary Co-operative Agricultural and Rural Development Banks at Taluk Level is responsible for long term credit disbursement for rural development in the state. Various activities covered by KSCARDB’s lending in scheme loan include Minor Irrigation, Plantation and Horticulture, Agricultural machinery, Land Development, poultry, fisheries etc., where as under ordinary loan include construction of Wells/Tanks, construction of Godowns/ cattle sheds, Barbed wire or stone fencing, Construction of drainage channels etc. The Bank raises funds through floating of debentures issued on government guarantee. The total long term loan disbursed during 2011-12 by KSCARDB was र1264.30 crore registering an increase of 29 percent. Long term loan disbursement and debentures floated by KSCARDB and purpose wise classification of long term loans issued by Primary Co-operative Agricultural and Rural Development Banks is shown in Appendix.2.121 and Appendix.2.122
Box 2.7
Refinance Support by NABARD
In Kerala the total refinance disbursement from NABARD was र 2684.87 crores during 2011-12. Commercial Banks accounted for the highest share of 71.4 percent in the total refinance disbursed in the state. This was followed by Kerala State Co operative Agricultural Rural Development Bank र 671.37 crore (25%) and RRBs. The disbursement of RRBs registered a lowest of 3.6 percent Agency wise and purpose wise disbursement of refinance assistance by NABARD in Kerala is given in Appendix 2.123 and Appendix 2.124.
The purpose-wise analysis of the refinance by NABARD reveals that as against the previous years, the major share of assistance was availed by plantation and horticulture sector (35.4%), followed by non farm sector (15%). Other major schemes availed refinance support was land development,
minor irrigation, dairy Development etc. The sectors like fisheries and poultry, which are very
important in the rural economy of Kerala were neglected during 2011-12 from the disbursement of refinance by NABARD. As against the declining trend in total refinance till 2011, 66 percent increase was reflected during 2012.
NABARD prepares Potential Linked Plans for all districts in the country as a part of the strategy
advocated by RBI for decentralizing the credit planning exercise. In Kerala the exercise outlined credit potential in agriculture & allied sectors and rural development projects and serves as an
important tool for banks in credit planning. Considering the infrastructure, discussions with line
departments, districtwise credit potential assessed during 2013-14 for crop loan is given in
Appendix 2.125.
Rural Infrastructure Development Fund (RIDF)
2.149 The RIDF was set up in NABARD with contribution from the Commercial banks which were not able to fulfill the commitment of channelising at least 18 per cent of their total lending to agriculture. RIDF has been instrumental in strengthening the rural infrastructure in the State. From RIDF I to XVII total sanction and disbursement stands at र159476.5 crores and र112815.4 crore respectively as on 31-03-2012.
Assistance to Kerala
2.150 Kerala has been receiving assistance under RIDF for the last fifteen years. The major projects for which refinance has been disbursed include watershed development projects, rural bridges, rural roads, reclamation of waterlogged area, inland navigation, tourism oriented roads and rural market yards. In Kerala the cumulative sanction and disbursement as on 31-03-2012 was र4458.6 crores (61.2%) and र 2728.3 crores respectively. During the XVII tranche an amount of र949.1 crore was sanctioned and र193.9 crores was disbursed on 469 projects. The tranche wise sanction and disbursement under RIDF are shown in Appendix 2.126
SECTION 8
Rural Development Programmes
2.151 Poverty and Unemployment are inter related and form a vicious circle. The major Centrally Sponsered Scheme of the Government of India under Rural Development focus on gainful wage employment as well as self employment opportunities to the poor so as to improve their livelihood
conditions. A brief review of the financial and physical progress of these Centrally Sponsered Scheme and Kudumbashree programmes are given in the following paras.
The Mahatma Gandhi National Rural Employment Guarantee Programme (MGNREGP)
2.152 MGNREGP provides for the enhancement of livelihood security of the households in rural
areas of the country by providing at least one hundred days of guaranteed wage employment in every financial year to every household, whose adult members volunteer to do unskilled manual work with the auxiliary objective being generating productive assets and protecting environment to achieve long term livelihood sustainability. In terms of auxiliary objectives, the programme is not a complete success in Kerala since we fail to attract the male work force with the meager per day wages of र 164 which is not sufficient to attract labour in Kerala. Hence we are unable to reap the benefits of the scheme in terms of productivity and maintenance of assets.
2.153 The average financial achievement of the programme during XIth Plan was 86%, the financial release being र 2945.5 crore. The financial achievement under MGNREGP during 2010-11 was 81.9% where as that of 2011-12 was 95%. The total employment in terms of mandays generated under MNREGP during the XIth plan was 16.8 crore. The employment generation during 2011-12 was 6.3crore mandays, 1.8 crore in excess of that in 2010-11. The physical and Financial progress of the programme 2012-13 till August 2012 is given in Appendix–2.127 & 2.128
Swarnajayanti Grama Swarozgar Yojana (SGSY)
2.154 The Swarnajayanti Grama Swarozgar Yojana (SGSY) which was in operation in the country from 1st April 1999 continued up to the 11th plan period. This programme was the massive self employment programme of GOI for poverty alleviation with focus on social mobilization through SHGs.
2.155 The financial achievement of the scheme was 95.1% during XIth plan, the target being र 261.1crore. The expenditure of the scheme during 2010-11 was 97% where as that of 2011-12 was just below, 96%. The targeted number of Self Help Group members assisted during XIth plan was 139971 and the physical achievements was cent percent. The physical target for 2010-11 and 2011-12 were to assist 33770 and 33970 SHG members respectively which was also fully achieved.
2.156 The SGSY programme has been restructured and rechristened as National Rural LivelihoodMission and under implementation from 2012-13 onwards. The project duration of the programme is 7 years and Kudumbashree Mission is the nodal agency for implementing the programme in the State at present.
Indira Awas Yojana (IAY)
2.157 The Indira Awas Yojana (IAY) is one of the six components of Bharat Nirman Programme of the Government of India for providing dwelling units to the homeless rural poor Below Poverty Line with a grant-in-aid of Rs.48, 500/- per house. The benefit of the programme will cover beneficiaries with at least two cents of land. As far as rural housing is concerned, IAY has provided 2.7 lakh houses during the XIth Plan (details given in Appendix 2.129 &2.130).
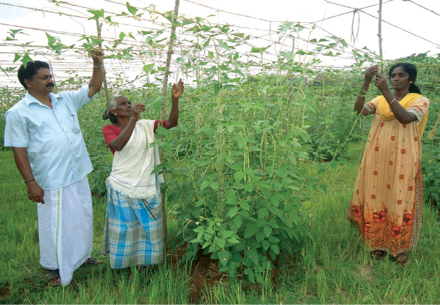
Rural Infrastructure Development – PMGSY
2.158 PMGSY is a100% CSS to build up rural infrastructure with the objective of facilitating a higher degree of rural – urban integration and for achieving an even pattern of growth for the poor and disadvantaged sections of the society. Some of the initiatives taken by the Government to facilitate building of rural infrastructure and development include the PMGSY.
2.159 Since Government of India funds can be utilized only for the actual estimated cost of construction of roads under scheme, state support to PMGSY for meeting tender excess, shifting of utilities and maintenance provision for assets already created was included in the state budget from the financial year 2010-11 onwards.
SECTION -9
Food security
2.160 Food Security implies “access to adequate and appropriate food throughout the life cycle of a human being from pregnancy to old age so as to ensure healthy body and mind”. Public Distribution System (PDS) ensures food security to people especially to Kerala where there is more than75% deficit in food grain production. Continuous decline of cultivated land and low production along with population pressure necessitates the need for strengthening Public Distribution System in the State.
Public distribution system
2.161 The Public Distribution System aims to i) provide food grains and other essential items to vulnerable sections of the society at reasonable (subsidized) prices fixed by the Government ii) put an indirect check on the open market prices of various items iii) prevent unfair trade practices like hoarding, undue profiteering and black marketing and iv) attempt socialization in matter of distribution of essential commodities.
2.162 Total number of card holders in the State during the 2011-12 was 78,98,005, which is 2,69,349 more than 2010-11 period(3.5 per cent increase). Similarly number of APL card holders also increased to 58,24,134 in 2011-12 from 55,71,568 of 2010-11 (4.5 per cent).But the number of BPL and Anthyodaya Anna Yojana (AAY) card holders decreased to 14,47,078 and 5,92,486 respectively in 2011-12 (1.1 percent and 0.44 per cent respcetively).
2.163 From 2012 April to May, APL card holders were allotted 1,03,032 MT of rice and 33,652 MT of wheat. Similarly rice allotted for BPL and AAY is 53,132 MT and 41,710 MT respectively and 13,926 MT of wheat has been allotted to BPL cardholders. Supply price of rice for APL and BPL during 2012 was र 8.90 and र 1.00 respectively and that of wheat is र 6.70 for APL and र 2.00 for BPL. Public Distribution System, Kerala profile: 2007-08 to 2011-12 is given in Appendix 2.131 and Distribution of rice, wheat, kerosene and sugar through PDS from 2006-07 to 2011-12(up to May) is shown in Appendix 2.132
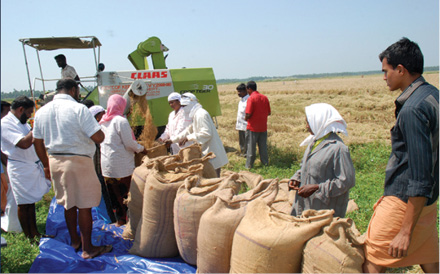
Scheme for Providing Food Grains at र 2/Kg.
2.164 This scheme is for providing food grains to all prescribed special category of beneficiaries @ र 2/Kg. In 25thJanuary, 2011 the Government of Kerala approved the schemes for providing food grains (Rice and Wheat) @ र 2/Kg. to all cardholders subject to certain conditions. 42.8 lakh APL beneficiaries were given rice and, 14.62 lakh BPL and 42.8 lakh APL beneficiaries were given wheat @ र 2/kg in 2010-11 while 42.23 lakh APL beneficiaries were provided with rice and, 14.55 lakh BPL and 42.23 lakh APL beneficiaries were provided with wheat@ र 2/Kg. in 2011-12. Quantity allotted and Subsidy amount required for meeting the expenditure under these scheme is furnished in Appendix 2.133.
Scheme for issue of food grains at Re.1/Kg
2.165 The scheme for issuing Rice @ Re.1/-per Kg. has been implemented in the State since 1st September 2011. In 2011-12 so far 14.55 lakh beneficiaries under BPL were supplied with rice while it was 14.62 lakh in 2010-11. Food grain distribution under PDS for BPL and APL from 1-9-2011 to 31-5- 2012 is given in Appendix 2.134.
Anthyodaya Anna Yojana Scheme (AAY)
2.166 The aim of the scheme is to provide 35 Kgs. of rice per month to the poorest of the poor families under BPL and is being implemented in the State since 25-12-2001. Allotment of rice continued at the level of 250260 MT in 2011-12 also. The Government of India supplies food grains to the State Government @ र 3/- per Kg., State Government in turn provides it to the beneficiaries at the subsidized rate of Re1/- Kg. Distribution of Food Grains under AAY and ANP Schemes during 2011-12 is given in Appendix 2.135.
Annapoorna Scheme
2.167 Under this scheme 10 Kg of rice per month is distributed to destitutes of the age of 65 years and above free of cost. The number of Annapoorna Cardholders is only 34,307 as on 31-03-2012. Quantity of rice allotted was 3600 MT and 1350 MT in 2010-11 and 2011-12 respectively. As every person in the State is covered by any of the pension schemes, finding beneficiaries for this scheme is difficult. Eligibility criteria for identifying Annapoorna beneficiaries may be relaxed so as to include more deserving persons in the scheme.
Central Allotment of Sugar and Kerosene
2.168 Central Allotment of Sugar was restricted to BPL/AAY cardholders alone from February 2001 onwards. The allotment of sugar to Kerala was 3879 MT (Up to April 2012). The central allotment of Kerosene was 21804 KL from 1/4/2012 to 31/ 5/ 2012.
SUPPLYCO – Second Line of PDS in the State
2.169 Kerala State Civil Supplies Corporation (SUPPLYCO) was set up in 1974 with a mission of “food security for Kerala” and acts as second line of PDS in the State by distributing essential commodities at reduced price. The corporation is head quartered in Kochi and operating through 5 regional offices, 56 depots and many retail outlets. Details of outlets are given in Appendix 2.136
2.170 Activities include market intervention for stabilizing the price of essential items, retailing of FMCGs (Fast Moving Consumer Goods) at lower price, conducting special fairs for arresting the undue rise in price during festive seasons, retailing of medicines by opening medical stores, acting as a nodal agency for the paddy procurement, arranging process of wheat and distribution of its products, acting as dealer of petroleum product like kerosene, petrol, diesel and LPG and also acting as nodal agency to implement the programme of Government of India to State to start Micro Biology Lab and Food Processing Unit. Sales turnover of SupplyCO from 2007-08 to 2011-12 is depicted in figure 2.15.
Mid-Day Meal Programme
2.171 The Mid-day Meal Programme, aimed at providing nutritional support to primary school going children and to give boost to universalisation of primary education by increasing enrolment, retention and attendance was introduced in 1995 by the Ministry of Human Resource Development. The Mid Day Meal Scheme is being implemented in the state with the financial support of State Government in addition to the Central assistance. The Government of India provides 100 grams of rice to primary children and 150 grams of rice to upper primary students per day. Government of India provides cooking cost also @ Rs.1.58 for primary and Rs.2.10 for upper primary students per day. Number of beneficiaries from 2007-08 to 2011-12 is shown in Fig. 2.16
Fig.2.15
SUPPLYCO - Sales Turnover
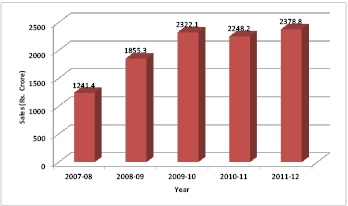
Source: SupplyCo
Fig.2.16
Mid-day Meal Programme
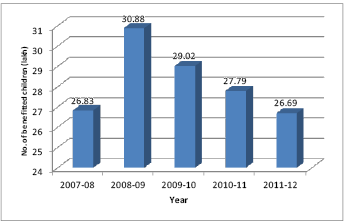
Source: SupplyCo
2.172 The supply of commodities to schools for Noon-Meal scheme in Kerala is entrusted to SupplyCo. The required quantity of rice has been taken from FCI and the pulses from their own stock. The cost of food grains is met by Education Department. During 2011-12 the Corporation supplied 4,92,512.11 Qtls of rice and 1,32,330.73 Qtls of pulses to 12638 schools and about. 26.69 lakh children got the benefit of the scheme. Details of mid-day Meal Programme - Supply of food grains from 2006-07 to 2011-12- is given in Appendix 2.137.
Prospects and Outlook
The Agriculture and Allied Sector is being promoted through a variety of schemes including subsidies and support prices, introduction of high technology and innovative techniques,provision of various credit options,watershed management and the like.The revival of this sector is essential for inclusive growth and food security.
New uncertainties for growth in 2012-13 in the State have emerged from the unsatisfactory progress of monsoon which has deepened the prospects of most of the crops. The implication of a drought in a perennial crop based agricultural economy could be quite long lasting. Coupled with this, globally the debt crisis in Europe intensified and China’s growth slowed which could affect the export prospects of commodities including marine products. The commodity forecast issued by the World Bank on January 15, 2013 has projected a lower international price for most of the commodities of our interest. The coconut oil price is projected to decline to $ 950/mt in 2013 from $ 1111/mt in 2012, Palm oil from $ 999 to $ 930/mt, Robusta coffee from € 227/kg to € 205/kg, tea from € 290 to € 285/kg, Shrimp from € 1006/kg to € 1005/kg, rubber (Malaysia ) from € 338 to € 330/kg.
The conservation and management of natural resources is required for building drought proof resilient system in the state. The short, medium and long term strategies are to be put in place to manage the drought situation. Risk Management Strategies targetting both production as well as price are crucial for the improvement of livelihood of the farmer for the revival of agriculture sector of the state.